Find Point Clusters finds clusters of points in surrounding noise based on their spatial or spatiotemporal distribution.

Usage notes
- The input DataFrame for Find Point Clusters must have a point geometry column. Find Point Clusters extracts clusters from the input DataFrame and identifies any surrounding noise.
-
There are two options available for the cluster method (
set):Cluster Method() - DBSCAN—Finds clusters of points that are in close proximity based on a specified search distance.
- HDBSCAN—Finds clusters of points using varying distances, allowing for clusters with varying densities based on cluster probability (or stability).
-
If DBSCAN is chosen, clusters can be found in either two-dimensional space only or both in space and time. If you specify a distance for
setand the input DataFrame has a timestamp, DBSCAN will discover spatiotemporal clusters of points that are in close proximity based on a specified search distance and search duration.Search Distance() -
The value set with
setis used differently, depending on the clustering method:Min Points Cluster() -
DBSCAN - Specifies the number of points that must be found within a search distance of a point for that point to start forming a cluster. The results may include clusters with fewer points than this value. Specify the search distance using
set. When using time to find clusters,Search Distance() setis required. When searching for cluster members, the value specified forSearch Duration() setmust be satisfied within both theMin Points Cluster() setandSearch Distance() setvalues to form a cluster. Note that this distance and duration are not related to the diameter or time extent of the point clusters discovered.Search Duration() -
HDBSCAN - Specifies the number of points neighboring each point (including the point itself) that will be considered when estimating density. This number is also the minimum cluster size allowed when extracting clusters.
-
-
HDBSCAN supports planar distance calculations only, and requires the input points to have a projected spatial reference (or none at all).
-
If DBSCAN is chosen, the method used to calculate distance between points can be chosen using
set. Choose fromDistance Method() planarorgeodetic. Ifsetis not called, the default distance method differs depending on the spatial reference of the input points:Distance Method() - If the input points have a projected spatial reference or no spatial reference, the tool will use planar distance to find clusters.
- If the input points do not have a projected spatial reference, the tool will use geodetic distance to find
clusters.
It is recommended to explicitly call
setif the input points are in a projected spatial reference. This will be required in a future release.Distance Method()
-
When using DBSCAN to find clusters, it is recommended that you use geodetic distance in the following circumstances:
-
Input points are near the antimeridian—When using the geodetic distance method, clusters of points can be found that span across the antimeridian. In this scenario, the input points should have either a non-projected spatial reference or spatial reference that supports wrapping around the antimeridian (such as World Cylindrical Equal Area).
-
Input points are not in a local projection—If your input points are in a local projection and your search distance is relatively small, you can use the planar distance method. Otherwise, consider using geodetic distance calculations for more accurate results.
-
Results
This tool produces a point DataFrame with the following fields:
| Field | Description |
|---|---|
CLUSTER | Identifies the cluster the point belongs to. Values of -1 are categorized as noise. |
COLOR | A field to help visualize clusters. Multiple clusters will be assigned each color. Colors will be assigned and repeated so that each cluster is visually distinct from its neighboring clusters. |
In addition to the above fields, additional fields are added depending on the cluster method:
-
If the DBSCAN clustering method is used with time to discover spatiotemporal clusters, results will also include the following fields:
Field Description cluster_start The start time of the time extent of the cluster a row belongs to. cluster_end The end time of the time extent of the cluster a row belongs to. You can use these fields to ensure that all cluster members are drawn together when visualizing spatiotemporal clusters with a time slider in applications like ArcGIS Pro. These fields are used for visualization only. For noise results,
startand_time endwill be equal to_time FEAT._TIME -
If the HDBCAN clustering method is used, results will also contain the following fields:
Field Description PROBThe probability that a point belongs in its assigned cluster. OUTLIERThe likelihood that a row is an outlier within its own cluster. A larger value indicates that the row is more likely to be an outlier. EXEMPLARThe points that are most representative of each cluster. These rows are indicated by a value of 1. STABILITYThe persistence of each cluster across a range of scales. A larger value indicates that a cluster persists over a wider range of distance scales.
Performance notes
Improve the performance of Find Point Clusters by doing one or more of the following:
-
Only analyze the records in your area of interest. You can pick the records of interest by using one of the following SQL functions:
- ST_Intersection—Clip to an area of interest represented by a polygon. This will modify your input records.
- ST_BboxIntersects—Select records that intersect an envelope.
- ST_EnvIntersects—Select records having an evelope that intersects the envelope of another geometry.
- ST_Intersects—Select records that intersect another dataset or area of intersect represented by a polygon.
- Be selective in the search distance and duration. A narrower search distance or radius may perform better on the same data.
Similar capabilities
The following tools perform similar capabilities:
Syntax
For more details, go to the GeoAnalytics Engine API reference for find point clusters.
| Setter (Python) | Setter (Scala) | Description | Required |
|---|---|---|---|
run(dataframe) | run(input) | Runs the Find Point Clusters tool using the provided DataFrame. | Yes |
set | set | Sets The algorithm used for cluster analysis. Supported options are ' and '. | Yes |
set | set | For DBSCAN, sets the method used to calculate distances between points. There are two methods to choose from: 'planar' or 'geodetic'. See Usage notes for the default option. | No |
set | set | This setter is used differently depending on the clustering method chosen. See the API documentation for more details. | Yes |
set | set | Sets the search distance within which the number of points specified by set must be found (in addition to being within the search duration, if applicable) to form a cluster using the DBSCAN algorithm. | Yes, for DBSCAN only. |
set | set | Sets the search duration within which the number of points specified by set must be found (in addition to being within the search distance) to form a cluster using the DBSCAN algorithm. | No |
Examples
Run Find Point Clusters
# Imports
from geoanalytics.tools import FindPointClusters
from geoanalytics.sql import functions as ST
from pyspark.sql import functions as F
# Path to the Earthquakes data
data_path = r"https://sampleserver6.arcgisonline.com/arcgis/rest/services/" \
"Earthquakes_Since1970/FeatureServer/0"
# Create an earthquakes DataFrame and transform the geometry to World Cylindrical Equal Area (54034)
df = spark.read.format("feature-service").load(data_path) \
.withColumn("shape", ST.transform("shape", 54034))
# Use Find Point Clusters to find clusters of earthquake occurrences across the globe
result = FindPointClusters() \
.setClusterMethod(cluster_method="HDBSCAN") \
.setMinPointsCluster(min_points_cluster=7) \
.run(dataframe=df)
# Show a selection of columns for the first 5 output clusters sorted by cluster id
result.filter((result["name"].contains("TAJIKISTAN")) & (result["CLUSTER_ID"] != -1)) \
.select("name", F.date_format("date_", "yyyy-MM-dd").alias("date_"), "PROB") \
.sort("name", "date_", ascending=False).show(5, truncate=False)+-----------------------------+----------+-------------------+
|name |date_ |PROB |
+-----------------------------+----------+-------------------+
|TAJIKISTAN: SHURAB, NEFTEABAD|1980-07-10|0.180143468626724 |
|TAJIKISTAN: SHARORA, GISSAR |1989-01-21|0.14929508441065453|
|TAJIKISTAN: ROSHTKALA, KHOROG|1988-09-24|0.17619107744283952|
|TAJIKISTAN: ROGHUN |2002-02-02|0.18251933904618436|
|TAJIKISTAN: ROGHUN |2002-01-08|0.18251933904618436|
+-----------------------------+----------+-------------------+
only showing top 5 rowsPlot results
# Create a continents DataFrame and transform the geometry to World Cylindrical Equal Area (54034)
continents_path = "https://services.arcgis.com/P3ePLMYs2RVChkJx/ArcGIS/rest/" \
"services/World_Continents/FeatureServer/0"
continents_df = spark.read.format("feature-service").load(continents_path) \
.withColumn("shape", ST.transform("shape", 54034))
# Plot the clustered results with the world continents data
continents_plot = continents_df.st.plot(facecolor="none",
edgecolors="black",
alpha=0.3,
figsize=(14,12))
result_noise_plot = result.where("COLOR_ID == -1").st.plot(geometry="shape",
color="lightgrey",
ax=continents_plot,
basemap="light")
result_clusters_plot = result.where("COLOR_ID != -1").st.plot(geometry="shape",
cmap_values="COLOR_ID",
is_categorical=True,
cmap="Paired",
ax=continents_plot,
legend=True,
legend_kwds={"title": "Cluster ID",
"loc": "lower right",
"bbox_to_anchor": (1.09, 0)})
result_clusters_plot.set_title("Point clusters and noise results (grey) for world earthquake occurrences")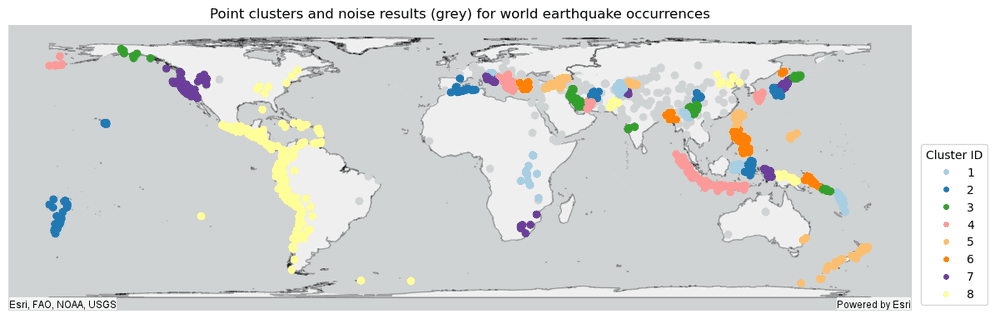
Version table
| Release | Notes |
|---|---|
1.0.0 | Python tool introduced |
1.6.0 | Scala tool introduced |
2.1.0 | Added support for geodetic distance with DBSCAN |