Find Similar Locations identifies the search records that are most similar or dissimilar to one or more reference records based on attributes.
Usage notes
-
The reference DataFrame is not required to have a geometry column.
-
The reference can be made using all of the records in the reference DataFrame or by applying a filter. If there is more than one record in the reference DataFrame, matching is based on averaged reference DataFrame column values. For example, if there are two reference records and one of the columns given in
setis a population variable, the tool will search for columns within the search DataFrame with populations that are similar to the average population values. If the population values are 100 and 102, for example, the tool will search for candidates in the search DataFrame with populations near 101.Analysis Fields() -
If there is more than one record in the reference DataFrame, choose analysis fields with similar values. For example, if the population value for one of the reference records is 100 and the other reference record is 100,000, the tool will search for matches with populations near the average of those two values: 50,050. Notice that this averaged value is far from the population value of either reference record.
-
Use
setto search for records that are either most similar or least similar to the reference records. In some cases, you may want to see both. For example, if the number of results is set to 3 withMost Or Least Similar() setand the specified value forNumber Of Results() setisMost Or Least Similar() Both, the tool will find the three most similar and the three least similar search records. -
Any given solution match in the output will be either a solution that is most similar or a solution that is least similar to the reference; a single solution cannot be both (and solution matches won't be duplicated in the output). Consequently, when the value of Both is specified for
set, the maximum number of resulting matches possible (Most Or Least Similar() set) will be half the number of the search DataFrame.Number Of Results() -
A maximum of 10,000 search DataFrame records will be returned.
-
The following options are available when using
set:Match Method() -
Attribute—The most similar candidates will have the smallest sum of squared differences for all fields specified usingValues set. All values are standardized before differences are calculated. The similarity index is returned in the outputAnalysis Fields() simindexfield. -
Attribute—The cosine similarity is measured. Cosine similarity searches for the same relationships among standardized field values rather than trying to match magnitudes. For example, suppose there are three analysis fields called A1, A2, and A3. A2 is twice as large as A1, and A3 is almost equal to A2. If the value of AttributeProfiles is specified usingProfiles set, the tool will search for candidates with those same attribute relationships: A2 is twice as large as A1, and A3 is almost equal to A2. Because this method is finding relationships between field values, you must specify a minimum of two analysis fields usingMatch Method() set. You could use the cosine similarity method (theAnalysis Fields() Attributeoption) to find places similar to Los Angeles, but at a different scale, for example, the profile of population compared to number of cars to number of residents less than 20 year old. The cosine similarity index ranges from 1.0 (perfect similarity) to -1.0 (perfect dissimilarity). The cosine similarity index is returned in the outputProfiles cosimindex(Cosine similarity) field.
-
-
The fields specified using
setshould be numeric and present, with the same field name and field type in both the reference and search DataFrames. If the tool doesn't find corresponding fields for the search DataFrame, a warning appears indicating that the missing attributes were dropped from the analysis.Analysis Fields()
Limitations
-
The reference DataFrame and search DataFrame must have at least one numeric field with a matching name.
-
When using the field profiles method, the reference DataFrame and search DataFrame must have at least two numeric fields with a matching name.
-
All columns from the search Dataframe are included in the output DataFrame by default. To maintain only specific columns, include the columns in the
setparameter.Append Fields()
Results
All of the reference and solution matches are returned to the output
along with any fields specified with set and
set. In addition, the following fields are
included in the output:
| Field | Description |
|---|---|
location | A string indicating whether records are a reference DataFrame record or search DataFrame record. |
simrank | When you specify MostSimilar or Both as the set value, all matches are ranked from most similar to least similar. The most similar solution match has a rank value of 1. |
dissimrank | When you specify LeastSimilar or Both for the set value, all of the solution matches are ranked from least similar to most similar. The solution that is least similar has a rank value of 1. |
simindex | This field quantifies how similar each solution match is to the target record. When you specify AttributeValues as the set value, this field value represents the sum of squared value differences. |
cosimindex | This field quantifies how similar each solution match is to the target record. When you specify AttributeProfiles as the set value, this field value represents the cosine similarity. |
labelrank | This field is for display purposes only. This field can be used for rendering of the analysis results. For more information on how to render results, see Visualizing results. |
reference | A unique ID value for reference records. Search records are given a null value. |
search | A unique ID value for search records. Reference records are given a null value. |
Performance notes
Improve the performance of Find Similar Locations by doing one or more of the following:
-
Only analyze the records in your area of interest. You can pick the records of interest by using one of the following SQL functions:
- ST_Intersection—Clip to an area of interest represented by a polygon. This will modify your input records.
- ST_BboxIntersects—Select records that intersect an envelope.
- ST_EnvIntersects—Select records having an evelope that intersects the envelope of another geometry.
- ST_Intersects—Select records that intersect another dataset or area of intersect represented by a polygon.
- Select only a few records from the reference DataFrame.
Similar capabilities
Use the Calculate field tool to calculate values on fields.
Syntax
For more details, go to the GeoAnalytics Engine API reference for find similar locations.
| Setter (Python) | Setter (Scala) | Description | Required |
|---|---|---|---|
run(reference | run(reference, search) | Runs the Find Similar Locations tool using the provided DataFrames. | Yes |
set | set | Sets the fields that will be used to determine similarity. They must be numeric fields, and the fields must exist on both input DataFrames. Depending on the match method selected, the tool will find locations that are most similar based on values or profiles of the fields. | Yes |
set | set | Sets which fields from the search DataFrame are included in the result. By default, all fields from the search DataFrame are appended. | No |
set | set | Sets the method that specifies how matching is determined. There are two options: ' (default) and '. | No |
set | set | Sets the locations that will be returned. Options include ', ', or '. | Yes |
set | set | Sets the number of ranked search locations to return. The default is 10 and the maximum allowed is 10000. | No |
Examples
Run Find Similar Locations
# Imports
from geoanalytics.tools import FindSimilarLocations
from geoanalytics.sql import functions as ST
# Path to the USA states data
states_data_path = "https://services.arcgis.com/P3ePLMYs2RVChkJx/ArcGIS/rest/" \
"services/USA_State_Boundaries/FeatureServer/0"
# Create a USA states boundaries DataFrame
states_df = spark.read.format("feature-service").load(states_data_path)
# Create a DataFrame with Oregon data
oregon_df = states_df.where("STATE_NAME = 'Oregon'")
# Create a DataFrame without the Oregon data
without_oregon_df = states_df.where("STATE_NAME != 'Oregon'")
# Run the Find Similar Locations tool to find the states that are most similar
# to Oregon based on population and crop data:
# - CROP_ACR12: The total area of cropland in acres in 2012.
# - AVE_SALE12: The average sales (dollars) of agricultural products per farm in 2012.
result = FindSimilarLocations() \
.setAnalysisFields("POPULATION", "CROP_ACR12", "AVE_SALE12") \
.setMostOrLeastSimilar(most_or_least_similar="MostSimilar") \
.setMatchMethod(match_method="AttributeValues") \
.setNumberOfResults(number_of_results=5) \
.setAppendFields("STATE_NAME", "SUB_REGION", "POPULATION",
"CROP_ACR12", "AVE_SALE12", "shape") \
.run(reference_dataframe=oregon_df, search_dataframe=without_oregon_df)
# View the first 6 rows of the result DataFrame
result.select("location_type", "STATE_NAME", "SUB_REGION",
"POPULATION", "CROP_ACR12", "AVE_SALE12",
"simindex", "simrank").sort("simrank").show()+-------------+--------------+------------------+----------+----------+----------+--------------------+-------+
|location_type| STATE_NAME| SUB_REGION|POPULATION|CROP_ACR12|AVE_SALE12| simindex|simrank|
+-------------+--------------+------------------+----------+----------+----------+--------------------+-------+
| reference| NULL| NULL| 4122334.0| 4690420.0| 137805.0| 0.0| 0|
| search| Louisiana|West South Central| 4786046.0| 4275637.0| 135600.0|0.011129297334172696| 1|
| search| Alabama|East South Central| 4951876.0| 2758521.0| 128894.0| 0.07068882355301415| 2|
| search| Mississippi|East South Central| 3044258.0| 5075579.0| 169162.0| 0.09554841321255343| 3|
| search|South Carolina| South Atlantic| 5037131.0| 1967288.0| 120323.0| 0.14108057320787182| 4|
| search| Utah| Mountain| 3113215.0| 1645898.0| 100746.0| 0.2477652573715553| 5|
+-------------+--------------+------------------+----------+----------+----------+--------------------+-------+Plot results
# Create a continental USA states DataFrame and transform the geometry
# to WGS 1984 Web Mercator for visualization
states_subset_df = states_df.where("""STATE_NAME != 'Alaska'
and STATE_NAME != 'Hawaii' and
STATE_NAME != 'District of Columbia'""") \
.withColumn("shape", ST.transform("shape", 3857))
# Create a DataFrame that contains only the "search" locations from the analysis result
result_subset_df = result.where("simrank > 0") \
.withColumn("shape", ST.transform("shape", 3857))
# Plot USA states that are most similar to Oregon
states_subset_plot = states_subset_df.st.plot(facecolor="none",
edgecolors="lightblue",
figsize=(16,10),
basemap="light")
result_plot = result_subset_df.st.plot(cmap_values="simrank",
cmap="Oranges_r",
legend=True,
legend_kwds={"shrink": 0.7},
ax=states_subset_plot)
result_plot.set_title("States most similar to Oregon in population and agriculture")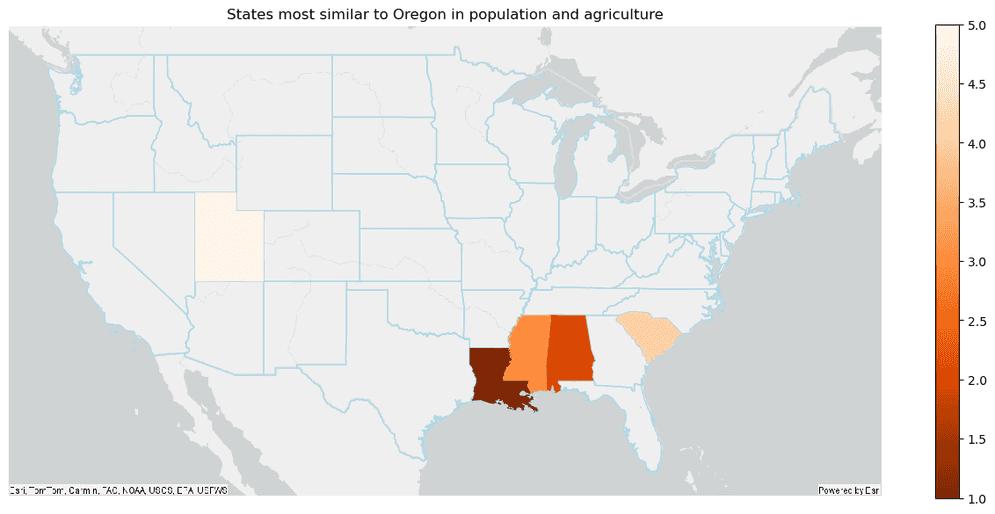
Version table
| Release | Notes |
|---|---|
1.0.0 | Python tool introduced |
1.6.0 | Scala tool introduced |