Aggregate functions summarize and find relationships between geometries in grouped data. You can group the rows of a DataFrame using one more more column values by calling groupBy on the DataFrame. For example, in this tutorial you will be grouping wind turbines by the name of the project they belong to. By grouping on a string column containing the project name, you can obtain a group of wind turbines for each project.
Data returns an instance of pyspark.sql.GroupedData,
which can be used to calculate the count, max, min, mean, and sum of each column in each group of rows. You can also use it to run
any of the aggregate functions in GeoAnalytics Engine.
In this tutorial you will learn how to use ST_Aggr_ConvexHull to calculate the convex hulls of groups of geometries and summarize each group.

Prerequisites
To complete the following steps, you will need:
- A running Spark session configured with ArcGIS GeoAnalytics Engine.
- A notebook connected to your Spark session (e.g. Jupyter, JupyterLab, Databricks, EMR, etc.).
- An internet connection (for accessing sample data).
Steps
Import
-
In your notebook, import
geoanalyticsand authorize the module using a username and password, an API key, or a license file.Python Python Scala Use dark colors for code blocks Copy import geoanalytics from geoanalytics.sql import functions as ST from pyspark.sql import functions as F
Read the sample data and plot
-
Create a DataFrame from a feature service of wind turbine point locations in the United States and print the schema. Apply a filter to only obtain turbines located in the state of Iowa.
Python Python Scala Use dark colors for code blocks Copy url = "https://services.arcgis.com/P3ePLMYs2RVChkJx/ArcGIS/rest/services/US_Wind_Turbine_Database/FeatureServer/0" wind_turbines = spark.read.format("feature-service").load(url).filter("t_state == 'IA'") wind_turbines.printSchema()ResultUse dark colors for code blocks Copy root |-- FID: integer (nullable = false) |-- case_id: integer (nullable = true) |-- faa_ors: string (nullable = true) |-- faa_asn: string (nullable = true) |-- usgs_pr_id: integer (nullable = true) |-- eia_id: integer (nullable = true) |-- t_state: string (nullable = true) |-- t_county: string (nullable = true) |-- t_fips: string (nullable = true) |-- p_name: string (nullable = true) |-- p_year: integer (nullable = true) |-- p_tnum: integer (nullable = true) |-- p_cap: double (nullable = true) |-- t_manu: string (nullable = true) |-- t_model: string (nullable = true) |-- t_cap: integer (nullable = true) |-- t_hh: double (nullable = true) |-- t_rd: double (nullable = true) |-- t_rsa: double (nullable = true) |-- t_ttlh: double (nullable = true) |-- t_conf_atr: integer (nullable = true) |-- t_conf_loc: integer (nullable = true) |-- t_img_date: timestamp (nullable = true) |-- xlong: double (nullable = true) |-- ylat: double (nullable = true) |-- shape: point (nullable = true) -
Plot the turbine points with a polygon representing the Iowa boundary.
PythonUse dark colors for code blocks Copy axes = wind_turbines.st.plot(figsize=(14, 14)) url = "https://services.arcgis.com/P3ePLMYs2RVChkJx/ArcGIS/rest/services/USA_Counties_Generalized_Boundaries/FeatureServer/0" ia = spark.read.format("feature-service").load(url).filter("STATE_NAME == 'Iowa'") ia.st.plot(ax=axes, facecolor="none", edgecolor="grey", basemap="light");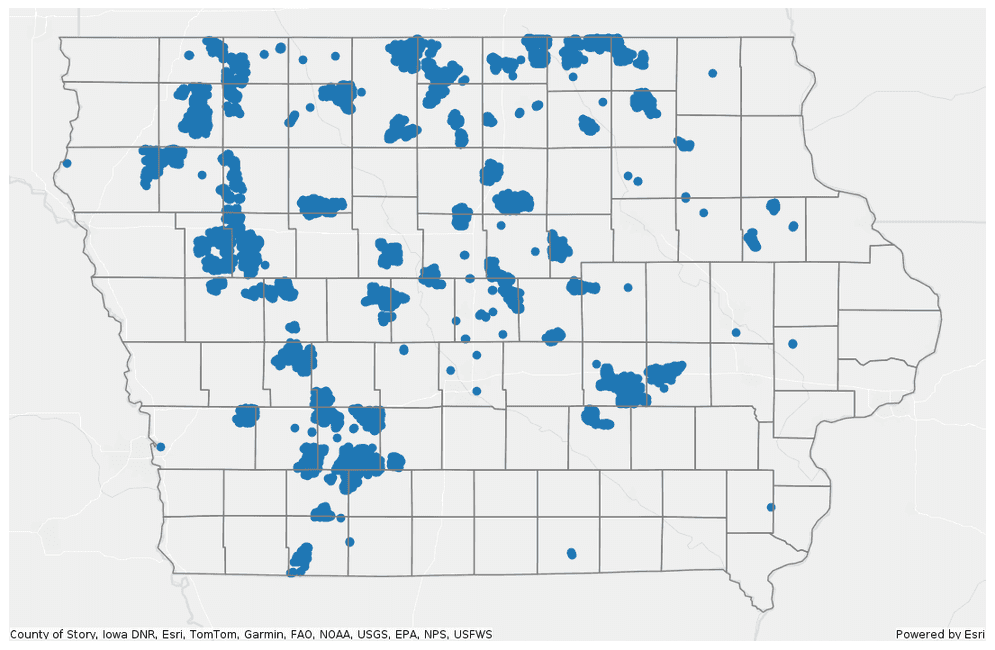
Group the data and create convex hulls
-
Group the wind turbines on the
pfield which contains the name of the project each turbine belongs to. Then use GroupedData.agg to call_name aggr. The result is a DataFrame with two columns: a polygon column containing the convex hull around each group, and a string column containing the_convex _hull pof each group._name Python Python Scala Use dark colors for code blocks Copy convex_hulls = wind_turbines.groupBy("p_name") \ .agg(ST.aggr_convex_hull("shape").alias("convex_hull")) convex_hulls.printSchema()ResultUse dark colors for code blocks Copy root |-- p_name: string (nullable = true) |-- convex_hull: polygon (nullable = true) -
Plot the convex hulls with a polygon representing the Iowa boundary.
PythonUse dark colors for code blocks Copy axes = convex_hulls.st.plot(figsize=(14, 14)) axes.set(title="Iowa Wind Power Projects") ia.st.plot(ax=axes, facecolor="none", edgecolor="grey", basemap="light");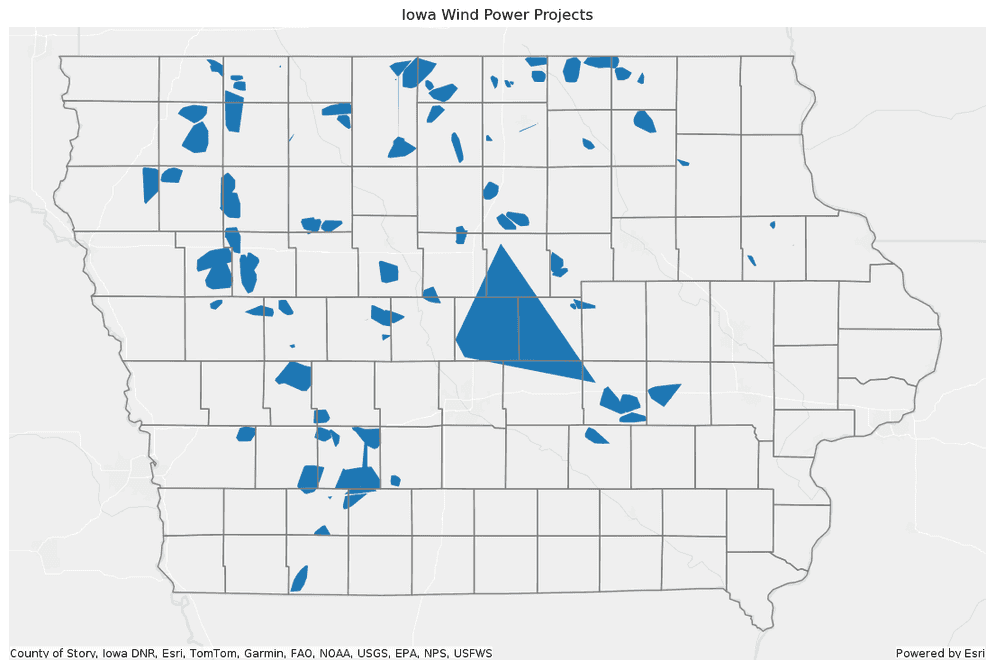
Group the data and create convex hulls with summary statistics
-
Because GroupedData.agg supports running multiple expressions at once, you can calculate summary statistics for each group in the same function call that creates convex hulls. This can be useful for visualizing the differences between groups or for enriching the result for further analysis.
Perform the same grouping as earlier, except this time calculate the total capacity, minimum year built, maximum height, and average height for each group of wind turbines in addition to the convex hull.
Python Python Scala Use dark colors for code blocks Copy convex_hulls_stats = wind_turbines.groupBy("p_name").agg(ST.aggr_convex_hull("shape").alias("convex_hull"), F.sum("t_cap").alias("sum_capacity"), F.min("p_year").alias("min_year_built"), F.max("t_ttlh").alias("max_height"), F.avg("t_ttlh").alias("avg_height"), F.count("p_name").alias("count")) convex_hulls_stats.printSchema()ResultUse dark colors for code blocks Copy root |-- p_name: string (nullable = true) |-- convex_hull: polygon (nullable = true) |-- sum_capacity: long (nullable = true) |-- min_year_built: integer (nullable = true) |-- max_height: double (nullable = true) |-- avg_height: double (nullable = true) |-- count: long (nullable = false) -
Plot the convex hulls and symbolize on the total capacity of each project.
PythonUse dark colors for code blocks Copy axes = convex_hulls_stats.st.plot(cmap_values="sum_capacity", vmin=2000, figsize=(14, 14), legend=True, legend_kwds={"label": "Total Capacity (W)", "orientation": "horizontal", "location": "bottom", "shrink": 0.8, "pad": 0.01}) axes.set(title="Iowa Wind Power Projects") ia.st.plot(ax=axes, facecolor="none", edgecolor="grey", basemap="light");
What's next?
While this tutorial only shows examples of ST_Aggr_ConvexHull, the same concepts apply to each aggregate function, including:
- ST_Aggr_Intersection—Calculate the intersection of the geometries in each group.
- ST_Aggr_MeanCenter—Calculate the mean center of the geometries in each group.
- ST_Aggr_StdevEllipse—Calculate the standard-deviational ellipse of the geometries in each group.
- ST_Aggr_Union—Calculate the union of the geometries in each group.
See each function's documentation for more information and examples.