Spatiotemporal Join transfers fields from one DataFrame to another based on spatial, temporal, and field attribute relationships, or some combination of the three. Optionally, statistics can be calculated for the joined records.

Usage notes
-
A spatial join matches records from the input DataFrames (
targetand_dataframe join) based on their spatial relationships. A temporal join matches records from the target DataFrames based on their temporal relationships. An attribute join matches records based on field values._dataframe -
You can join records based on a spatial relationship, a temporal relationship, an attribute relationship, or a combination of the three.
Option Description setSpatial Relationship() The spatial relationship that will determine whether records are joined to each other. The available relationships depend on the geometry type (point, linestring, or polygon) of the DataFrames being joined. Available spatial relationships are as follows: - Intersects
- Equals
- NearPlanar
- NearGeodetic
- Contains
- Within
- Touches
- Crosses
- Overlaps
setTemporal Relationship() The temporal relationship that will determine whether records are joined to each other. The available relationships depend on the time type (instant or interval) of the DataFrames being joined. Available temporal relationships are as follows: - Meets
- MetBy
- Overlaps
- OverlappedBy
- During
- Contains
- Equals
- Finishes
- FinishedBy
- Starts
- StartedBy
- Intersects
- Near
- NearBefore
- NearAfter
setAttribute Relationship() The attribute relationship that will determine whether records are joined to each other. Records are matched when the field values in the join DataFrame are equal to the field values in the target DataFrame. -
If the target DataFrame and join DataFrame are in different coordinate systems, the coordinate system of the target DataFrame will be used.
-
When
'is specified withNear Planar' set, it is required that the target DataFrame's geometry has a projected coordinate system or the tool will fail. You can transform your data to a projected coordinate system by using ST_Transform.Spatial Relationship() -
If multiple join records match the same target record, you can decide whether all the matching records will be joined (
set) or all the matching records will be summarized together (Join One To Many() set) as follows:Join One To One() -
One-to-many—Joins all the matching records in the join DataFrame to the target DataFrame. The resulting DataFrame will contain multiple records of the target record. If
Trueis specified forset, all input records are written to the output DataFrame.Left Join() -
One-to-one—Summarizes all of the matching join records with each record in the target DataFrame. Only the records that have a match will be included in the summary and output. The count of joined records will be added, in addition to other standard statistics such as sum, minimum, maximum, range, mean, variance, standard deviation, first, and last, as well as string statistics including count, any, first, and last. By default, only those join records that have the specified relationships will be maintained in the output DataFrame (inner join). If
Trueis specified forset, all input records are written to the output DataFrame.Left Join() -
To add first or last statistic field in the output, time needs to be enabled on the input DataFrames.
-
-
Examples of a one-to-many and one-to-one attribute join are shown below. In this example, the one-to-one join only includes the count; additional statistics that can be calculated using
add.Summary Field()

-
You can optionally build an expression to join records using
set. This should always be used with a spatial, temporal, or field attribute relationship, or some combination of the three. If you specify an expression, only records that meet the condition will be used. For example, using the expressionJoin Condition() $target[', you only join target records if theMagnitude'] > $join[' Explosion'] Magnitudefield is greater than theExplosionfield in the join record. See Arcade expressions for more information. -
You can optionally return the spatial distance and temporal difference of the joined records by setting the
includeparameter. Spatial distance calculations are returned in a field namedDistance() distance, a double column. The distance method used is determined by thespatialparameter. For example, if you specify_relationship ', the geodetic distance method is applied when calculating the distance. Similarly, temporal difference calculations are returned in a field namedNear Geodetic' timegap, represented as milliseconds in a long column. The output fields and values are outlined below:-
The
distancefield can have the following values:- 0—This represents the target and join geometries intersect
- Greater than 0—This represents the distance between the join and target records geometries. The default distance unit is meters.
- Null values—This represents the case where geometries are further apart than the
nearparameter in the_distance setsetter.Spatial Relationship()
-
The
timegapfield can have the following values:- Less than 0—This represents the time difference between the target and join records. Negative values mean the join record occurs before the target record.
- 0—This represents times that intersect.
- Greater than 0—This represents the time difference between the target and join records. Positive values mean the target records occurs before the join record.
- Null values—This represents the case where records did not meet the join condition. For example, they are further apart
than the
nearin the_duration setsetter, or the ordering of the target and join records did not match given relationship, such asTemporal Relationship() Near.Before
-
Results
The fields in the output DataFrame differ depending on the join operation.
One-to-many join
-
The following fields are included in the output DataFrame when running a one-to-many join:
- All fields from the target DataFrame
- All fields from the joined DataFrame
If the same non-geometry field name exists in the target and join DataFrame, the joined field will start with the word join (for example join_fieldname).
If the same geometry field name exists in the target and join DataFrames, the result will have multiple geometry fields with the same name, where the first geometry field in the result schema is from the target DataFrame and the second geometry field is from the joined DataFrame. You can rename the geometry fields of your input DataFrames to be unique before joining to avoid confusion.
If you set the include parameter, your output will have fields named distance and timegap representing
the spatial distance and temporal difference between the joined features. It is recommended to rename the resulting
distance column to include the distance unit specified in include. For example, rename distance to
distance to preserve the unit of the column values for future reference.
One-to-one join
In addition to all fields from the target DataFrame, the following fields are included in the output records when running a one-to-one join:
| Field | Description |
|---|---|
count | The count of records that have been joined. |
<statistic | Specified statistics will each create an attribute field, named in the following format: statistic_fieldname. For example, the maximum and standard deviation of the id field is MAX_id and SD_id. |
Performance notes
Improve the performance of Spatiotemporal Join by doing one or more of the following:
-
Only analyze the records in your area of interest. You can pick the records of interest by using one of the following SQL functions:
- ST_Intersection—Clip to an area of interest represented by a polygon. This will modify your input records.
- ST_BboxIntersects—Select records that intersect an envelope.
- ST_EnvIntersects—Select records having an evelope that intersects the envelope of another geometry.
- ST_Intersects—Select records that intersect another dataset or area of intersect represented by a polygon.
- Make the join conditions as selective as possible. For example, a near join of 1 kilometer will perform better than a near join of 5 kilometers on the same DataFrame.
- Add more than one join condition. Additional join conditions make the join more selective. For example, a near join of 1 kilometer and 1 hour will perform better than a near join of 1 kilometer on the same data.
- Apply a join expression.
- Calculating the
distanceandtimegapfields may increase processing time. - Planar distance calculation (specified with the
'option inNear Planar' set) will perform better than geodetic.Spatial Relationship - If the data is in a geographic coordinate system but for small, local areas, project it to a local coordinate system,
and specify
'in theNear Planar' spatialparameter. You can transform your data to a projected coordinate system by using ST_Transform._relationship
- If the data is in a geographic coordinate system but for small, local areas, project it to a local coordinate system,
and specify
Similar capabilities
Syntax
For more details, go to the GeoAnalytics Engine API reference for spatiotemporal join.
| Setter (Python) | Setter (Scala) | Description | Required |
|---|---|---|---|
run(target | run(target, join) | Runs the Spatiotemporal Join tool using the provided DataFrames. | Yes |
set | set | Sets a target field, relationship, and join field used to join equal attributes. | One of set, set, orset is required. |
set | set | Sets the join operation to one to many. If multiple join records are found that have the same relationships with a single target record, there will be multiple copies (records) of the target record joined to each matching join record. | One of set or set is required. |
set | set | Sets the join operation to one to one. If multiple join records are found that have the same relationships with a single target record, the fields associated with the multiple join records will be aggregated using the specified summary statistics. | One of set or set is required. |
set | set | Sets the spatial relationship used to spatially join records. | One of set, set, or set is required. |
set | set | Sets the temporal relationship used to temporally join records. | One of set, set, or set is required. |
add | add | Adds a summary statistic of a field in the join DataFrame to the result DataFrame. | No |
set | set | Sets a condition to specified fields using an Arcade expression. Only records with fields that meet this conditions will be joined. | No |
set | set | Specifies whether all target records will be returned in the result DataFrame (known as a left outer join) or only those that have the specified relationships with the join records (inner join). Left outer join can be used with one-to-one join or for one-to-many join. | No |
include | include | Include spatial distance and/or temporal difference calculated between target and join features. Set include to True to include distance and/or timegap fields in the result. The distance can be chosen from ', ', ', ', ', or '. | No |
Examples
Run Spatiotemporal Join
# Imports
from geoanalytics.tools import ReconstructTracks
from geoanalytics.tools import SpatiotemporalJoin
from geoanalytics.sql import functions as ST
from pyspark.sql import functions as F
# Path to the hurricane track points data and USA counties data
hurricanes_data_path = r"https://services2.arcgis.com/FiaPA4ga0iQKduv3/arcgis/rest/" \
"services/IBTrACS_ALL_list_v04r00_points_1/FeatureServer/0"
counties_data_path = r"https://services.arcgis.com/P3ePLMYs2RVChkJx/ArcGIS/rest/" \
"services/USA_Counties_Generalized_Boundaries/FeatureServer/0"
# Create DataFrames for hurricane track points and USA counties
hurricanes_df = spark.read.format("feature-service").load(hurricanes_data_path)
hurricanes_df = hurricanes_df.withColumn("usa",
ST.bbox_intersects("shape",
xmin=-14165303, xmax=-7384568,
ymin=1947768, ymax=7426938)).where("usa=true")
counties_df = spark.read.format("feature-service").load(counties_data_path)
# Reconstruct hurricane points into tracks using Reconstruct Tracks
rt_result = ReconstructTracks() \
.setTrackFields("NAME") \
.setDistanceMethod(distance_method="Geodetic") \
.run(dataframe=hurricanes_df)
# Use Spatiotemporal Join to join the hurricane tracks to each county
join_result = SpatiotemporalJoin() \
.setLeftJoin(left_join=True) \
.setJoinOneToOne()\
.setSpatialRelationship(spatial_relationship="Intersects") \
.run(target_dataframe=counties_df, join_dataframe=rt_result)
join_result.select("OBJECTID", "NAME", "STATE_NAME", "COUNT") \
.sort(F.desc("COUNT"), F.desc("STATE_NAME")).show(5)+--------+---------------+--------------+-----+
|OBJECTID| NAME| STATE_NAME|COUNT|
+--------+---------------+--------------+-----+
| 1373| Polk County| Florida| 32.0|
| 1369| Osceola County| Florida| 28.0|
| 324|Colleton County|South Carolina| 27.0|
| 1325| Brevard County| Florida| 27.0|
| 528| Ware County| Georgia| 26.0|
+--------+---------------+--------------+-----+
only showing top 5 rowsPlot results
# Plot the join result and visualize the frequency of hurricanes for each county
result_plot = join_result.st.plot(cmap_values="COUNT",
cmap="coolwarm",
legend=True,
figsize=(14,8),
geometry="shape",
basemap="light")
result_plot.set_title("USA counties visualized by count of intersecting hurricanes")
result_plot.set_xlim(left=-178.2175984, right=-66.969271)
result_plot.set_ylim(bottom=18.9217862999998, top=71.406235408712);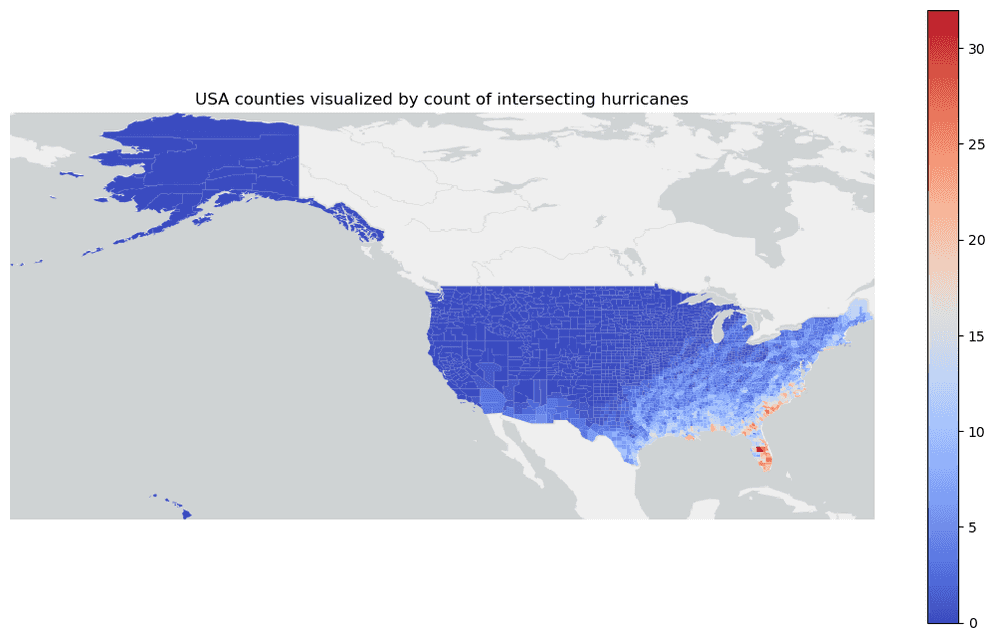
Version table
| Release | Notes |
|---|---|
1.0.0 | Python tool introduced |
1.1.0 | Added support for left one-to-many join. |
1.2.0 | Added support for spatial distance and temporal difference in near join. |
1.6.0 | Scala tool introduced |