Calculate Motion Statistics calculates movement statistics and descriptors for time-enabled points that represent one or more moving entities. The input DataFrame must be point geometries with an instant timestamp.

Usage notes
| Term | Description |
|---|---|
| Geodetic | A line drawn on a sphere. A geodetic line drawn on the globe represents the curvature of the earth's geoid. |
| Planar | A straight-line distance as measured on a flat surface (that is, a Cartesian plane). This is also referred to as Euclidean distance. |
| Instant | A single moment in time represented by a start time and no end time. |
| Segment | The path between two sequential observations in a track. |
| Track | A sequence of point observations that are time enabled with time type instant. Rows are determined to be in the sequence by a track identifier field and are ordered by time. For example, a city can have a fleet of snow plow trucks that record their location every 10 minutes. The vehicle ID can represent the distinct tracks. |
-
Specify one or more fields to identify unique entities, also known as tracks. Tracks are represented by the unique combination of one or more track fields. For example, if the
flightandID Destinationfields are used as track identifiers, the recordsI,D007 SoldenandI,D007 Tokyowould be in different tracks since they have different values for theDestinationfield. -
By default, all supported statistics will be calculated for each input point if possible. Alternatively, you can choose one or more groups of statistics to calculate using
set.Motion Statistics()
-
Distances are calculated using the geodetic distance method by default when your input geometries are not projected. To override this default behavior, use
set. It is recommended that you use geodetic distance in the following circumstances:Distance Method() -
Tracks cross the antimeridian—When using the geodetic method, input DataFrames that cross the antimeridian will have tracks that correctly cross the antimeridian. Your input DataFrame or processing spatial reference must be set to a spatial reference that supports wrapping around the antimeridian, for example, a global projection such as World Cylindrical Equal Area.
-
Your DataFrame is not in a local projection—If your input DataFrame is in a local projection, use the planar distance method. For example, use the planar method to examine trace events within a single state. Your input DataFrame or processing spatial reference must be set to a spatial reference local to your dataset.
-
- You must use
setif your input data is in a projected coordinate system.Distance Method()
-
Minimum, maximum, average and total statistics are calculated using the current observation and a number of previous observations defined by
set. Other statistics are always calculated using only the current and previous observation and do not consider the track history window value. For example, if you set a track history window value of 5 and specify Speed as the value forTrack History Window() set, the current observation and the previous four observations will be used to calculate MinSpeed, MaxSpeed, and AvgSpeed fields at each observation, while the Speed field will be calculated using only the current and previous observations at each point. The value specified forMotion Statistics() setmust be greater than 1. The default is 3.Track History Window() -
If there are fewer observations in a track's history than the value specified using
set, statistics starting withTrack History Window() Min,Max,Avg, orTotwill be calculated using all observations in the track history. -
Statistics will not be calculated for the first record in each track. Statistics in the acceleration group will not be calculated for the first two records in each track.
-
The result values will be in the units specified using
set.Statistic Units() -
When calculating statistics on large tracks, you can use
setto split the large tracks into smaller tracks to improve performance.Time Boundary Split() -
See the Results section below for a list of the calculated statistic fields.
Limitations
- The input DataFrame must be points that have a timestamp representing an instant in time. Any records that do not have time or geometry are not included in the result.
Results
The result of Calculate Motion Statistics is a copy of the input DataFrame with a new field for each calculated statistic.
The following statistic fields will be calculated for the distance group:
| Field | Description |
|---|---|
Distance | Distance traveled from the previous observation to the current. |
Tot | Sum of distances traveled between observations in the track history window. |
Min | Minimum of distances traveled between observations in the track history window. |
Max | Maximum of distances traveled between observations in the track history window. |
The following statistic fields will be calculated for the speed group:
| Field | Description |
|---|---|
Speed | Speed of travel from the previous observation to the current. |
Min | Minimum speed between observations in the track history window. |
Max | Maximum speed between observations in the track history window. |
Avg | The sum of distances between observations in the track history window divided by the sum of durations between observations in the track history window. |
The following statistics fields will be calculated for the acceleration group:
| Field | Description |
|---|---|
Acceleration | The difference between the current speed and previous speed divided by the current duration. |
Min | Minimum acceleration calculated in the track history window. |
Max | Maximum acceleration calculated in the track history window. |
Avg | The difference between the current and first speeds in the track history window divided by the sum of durations between observations in the track history window. |
The following statistic fields will be calculated for the duration group:
| Field | Description |
|---|---|
Duration | The elapsed time since the previous observation. |
Tot | Sum of durations in the track history window. |
Min | Minimum duration in the track history window. |
Max | Maximum duration in the track history window. |
Avg | Sum of durations in the track history window divided by the number of points. |
The following statistics fields will be calculated for the elevation group:
| Field | Description |
|---|---|
Elevation | Current elevation of the observation. |
Elev | Difference between the current and the previous elevation. |
Tot | Sum of elevation changes between the points in the track history window. This can be a negative value. |
Min | Minimum elevation in the track history window. |
Max | Maximum elevation in the track history window. |
Avg | Sum of elevations in the track history window divided by the number of points. |
The following statistics fields will be calculated for the slope group:
| Field | Description |
|---|---|
Slope | Ratio of elevation change to distance between the current and previous observations. |
Min | Minimum slope in the track history window. |
Max | Maximum slope in the track history window. |
Avg | Sum of slopes in the track history window divided by the number of points. |
The following statistics fields will be calculated for the idle group:
| Field | Description |
|---|---|
Idling | Returns true if the distance between the current observation and the previous is less than the distance value specified using set, and the duration between the current observation and the previous is at least the time value specified using set. Returns false if one or both of those conditions are not met. |
Tot | Sum of duration in the track history window that meet idling criteria. |
Pct | Percentage of time for which idling was detected. |
The following statistics field will be calculated for the bearing group:
| Field | Description |
|---|---|
Bearing | Angle of travel from the previous observation to the current observation. |
Performance notes
Improve the performance of Calculate Motion Statistics by doing one or more of the following:
-
Only analyze the records in your area of interest. You can pick the records of interest by using one of the following SQL functions:
- ST_Intersection—Clip to an area of interest represented by a polygon. This will modify your input records.
- ST_BboxIntersects—Select records that intersect an envelope.
- ST_EnvIntersects—Select records having an evelope that intersects the envelope of another geometry.
- ST_Intersects—Select records that intersect another dataset or area of intersect represented by a polygon.
- Decrease the track history window size using
set.Track History Window() - Specify a value for
setto break up large tracks at a defined time interval.Time Boundary Split()
Similar capabilities
The following tools perform similar capabilities:
How Calculate Motion Statistics works
The diagram below shows a track with six sequential points. The statistics are calculated based on each row's elevation, distance, and time.

The following table summarizes the statistics calculations for the diagram above. All calculations are evaluated at point 5 and the track history window is 3. An observation is considered idling if it has moved less than 32 meters in 1 minute.
| Statistics | Formula | Example |
|---|---|---|
| Distance | 35 m | |
| Total Distance | 80 + 30 + 35 = 145 m | |
| Speed | Distance / Duration | 35 / 60 = 0.58 m/s |
| Average Speed | Total Distance / Total Duration | 145 / 180 m/s |
| Acceleration | (0.58 -- 0.5) / 60 = 0.001 m/s2 | |
| Average Acceleration | (Speed(last) - Speed(first)) / (Total Duration) | (0.58 -- 1.33) / 60 = -0.01 m/s2 |
| Duration | 60s | |
| Total Duration | 60 + 60 + 60 = 180 s | |
| Elevation | 5 m | |
| Elevation Change | 5 - 4 = 1 m | |
| Total Elevation Change | 5 - 0 = 5 m | |
| Slope | Elevation Change /Distance | 1 / 35 |
| Average Slope | Total Elevation Change/ Total Distance | 5 / 145 |
| Idling | False | |
| Total Idle Time | 60 s | |
| Percentage Idle Time | .5 | |
| Bearing | 0 |
Syntax
For more details, go to the GeoAnalytics Engine API reference for calculate motion statistics.
| Setter (Python) | Setter (Scala) | Description | Required |
|---|---|---|---|
run(dataframe) | run(input) | Runs the Calculate Motion Statistics tool using the provided DataFrame. | Yes |
set | set | Sets the method used to calculate distances between track observations. There are two methods to choose from: ' or '. See Usage notes for the default option. | Required when track observations have projected coordinates. |
set | set | Sets the tolerances to use to decide if an entity is idling. An entity is idling when it hasn’t moved more than the distance tolerance in at least the time tolerance. | Yes, if idle statistics are calculated. |
set | set | Sets the statistic groups that will be calculated. By default all statistics will be calculated. | No |
set | set | Sets the output units for each statistic group. | No |
set | set | Sets boundaries to limit calculations to defined spans of time. | No |
set | set | Sets one or more fields used to identify distinct tracks. | Yes |
set | set | Sets the number of observations (including the current observation) that will be used when calculating summary statistics that are not instantaneous. This includes minimum, maximum, average, and total statistics. The default is 3. | No |
Examples
Run Calculate Motion Statistics
# Imports
from geoanalytics.tools import CalculateMotionStatistics
from geoanalytics.sql import functions as ST
# Path to the Seattle example tracks data
data_path = r"https://services1.arcgis.com/36PP9fe9l4BSnArw/arcgis/rest" \
"/services/seattle_example_tracks/FeatureServer/0"
# Create a DataFrame from the Seattle example tracks data
df = spark.read.format("feature-service").load(data_path)
# Calculate Motion Statistics to enhance your data with speed and idling statistics
result = CalculateMotionStatistics() \
.setTrackFields("user_id") \
.setTrackHistoryWindow(track_history_window=5) \
.setMotionStatistics("Speed", "idle") \
.setIdleTolerance(distance_tolerance=100,
distance_tolerance_unit="Feet",
time_tolerance=5,
time_tolerance_unit="Minutes") \
.setDistanceMethod(distance_method="Planar") \
.setStatisticUnits(speed_unit="FeetPerSecond") \
.run(dataframe=df)
# Show a selection of columns for the first 5 records in the result DataFrame
result.filter(result["user_id"] == 'user1') \
.select("user_id", "Speed", "MinSpeed", "MaxSpeed","AvgSpeed", "Idling", "TotIdleTime") \
.sort("AvgSpeed", ascending=False) \
.show(5)+-------+------------------+------------------+-----------------+------------------+------+-----------+
|user_id| Speed| MinSpeed| MaxSpeed| AvgSpeed|Idling|TotIdleTime|
+-------+------------------+------------------+-----------------+------------------+------+-----------+
| user1|5.2204847202976685|5.2204847202976685|6.892290697309563|5.7618999711114105| false| 0.0|
| user1| 5.526445079215372| 5.164426033535724|6.892290697309563|5.7478852994209255| false| 0.0|
| user1| 6.278522175413303| 4.358639317727936|6.452378996093401| 5.644197059655965| false| 0.0|
| user1| 5.408379387623038| 4.638848823449657|6.892290697309563| 5.525986235479496| false| 0.0|
| user1| 4.575716510069646| 4.451734493505993|6.881149550040065| 5.47720959430053| false| 0.0|
+-------+------------------+------------------+-----------------+------------------+------+-----------+
only showing top 5 rowsPlotting results
# Plot the enhanced results and show the average speed of user6
result_plot = result.where("user_id = 'user6'").st.plot(cmap_values="AvgSpeed",
cmap="plasma",
legend=True,
figsize=(14,8),
aspect="auto",
basemap="light")
result_plot.set_title("Average speed in feet per second for user6")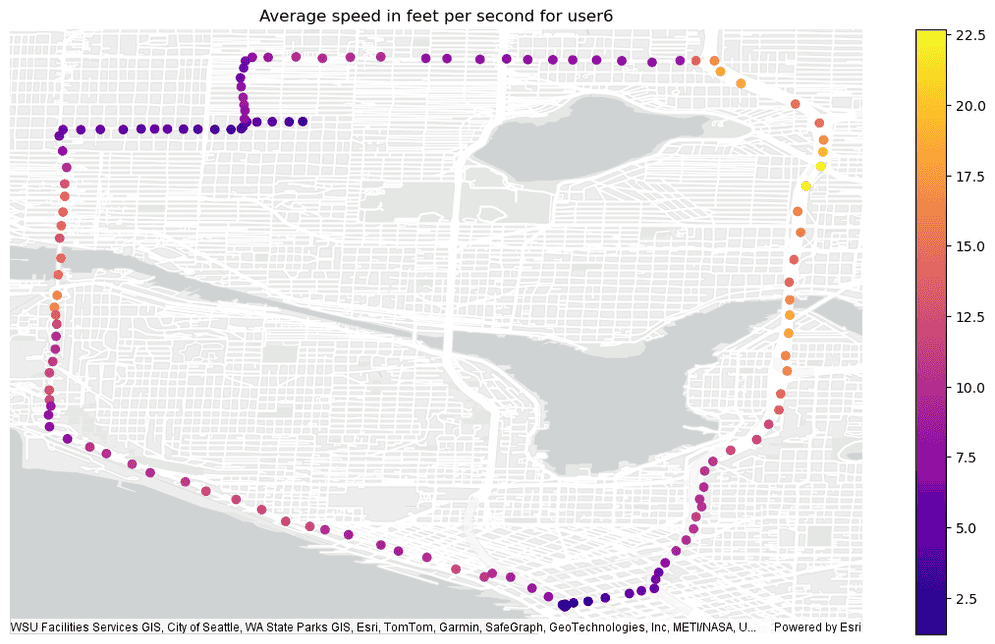
Version table
| Release | Notes |
|---|---|
1.0.0 | Python tool introduced |
1.6.0 | Scala tool introduced |