Trace Proximity Events analyzes time-enabled points representing moving entities. The tool follows entities of interest in space (location) and time to see which other entities the entities of interest have interacted with. The trace will continue from entity to entity to a configurable maximum degrees of separation from the original entity of interest.

Usage notes
| Term | Definition | Example |
|---|---|---|
| Entity | A moving object with position periodically recorded. | An animal, person, or vehicle. An entity may be stationary or moving. |
| Entities of interest | The specific entities used to start a trace. | A person infected with COVID-19. |
| Proximity event | When two entities are near each other within a period of time. | Two people that come within 3 meters of each other and within a 1-minute window of each other. |
| Depth | The degree of separation between an entity of interest and an entity further down the trace (downstream). | A proximity event between the entity of interest and someone else is depth 1. |
| Trace event | The first contact for a specified entity downstream from the entities of interest. |
-
The following are examples of use cases that can be performed with the Trace Proximity Events tool:
-
An organization monitors company-issued devices carried by workers. The company is interested in determining which employees were near an individual known to have coronavirus disease 2019 (COVID-19). Using a DataFrame representing device locations and time, they identify devices that have been within six meters and five minutes of the contagious person and other possibly contagious employees.
-
An NGO is monitoring salmon populations using GPS and is interested in tracking the spread of salmon lice between escaped farmed salmon and wild populations. Some GPS-tagged farmed salmon are tracked to see if they come in close proximity with tagged wild populations, and how those wild populations may further spread the disease. The measurements also include a depth field, which the NGO uses to only find fish at a similar depth.
-
-
When tracing proximity events, it is your responsibility to understand organizational, local, and national guidelines regarding data sensitivity and privacy.
-
When using proximity tracing to find the transmission (such as a disease), be aware of the following:
- The presence of a trace event does not guarantee that it has been transmitted; it is only a potential encounter.
- The absence of a trace event does not mean that something hasn’t been transmitted. In cases such as a disease, there may be transmission through other vectors.
- When possible, use
setto constrain proximity events when required. For example, use attributes to constrain the room, floor, or elevation.Attribute Match Criteria()
-
Specifying a larger value for
setandSearch Duration() setresults in more events and takes longer to process the results. Smaller distances results in fewer events and a shorter processing time.Search Distance() -
Records must meet both the temporal search distance and the spatial search distance criteria to be considered near each other.


-
Use domain-specific knowledge to determine the values used for
setandSearch Duration() set. Consider factors such as the accuracy of the device when setting the distances.Search Distance() -
The entity of interest is where the proximity tracing begins. If you specify a start time, tracing begins at that time for that entity. If you do not specify a time, tracing begins on January 1, 1970 for that entity.
-
Defining the entities of interest requires entity ID values from the input DataFrame and optionally a start time value from which tracing will begin.
-
Distances are calculated using the geodetic distance method by default when your input geometries are not projected. To override this default behavior, use
set. It is recommended that you use geodetic distance in the following circumstances:Distance Method() -
Tracks cross the antimeridian—When using the geodetic method, input DataFrames that cross the antimeridian will have tracks that correctly cross the antimeridian. Your input DataFrame or processing spatial reference must be set to a spatial reference that supports wrapping around the antimeridian, for example, a global projection such as World Cylindrical Equal Area.
-
Your DataFrame is not in a local projection—If your input DataFrame is in a local projection, use the planar distance method. For example, use the planar method to examine trace events within a single state. Your input DataFrame or processing spatial reference must be set to a spatial reference local to your dataset.
-
- You must use
setif your input data is in a projected coordinate system.Distance Method()
-
You can set additional requirements for a proximity event:
-
For example, you can trace only individuals in a particular building on a campus, or you can trace only within one level of a building. Use
setto specify constraining attributes. For example, to constrain entities on the same floor, specify the Floor field.Attribute Match Criteria() -
By default, all traces between an entity of interest and an entity farther down the trace are found. Use
setto limit the depth.Max Trace Depth()
-
-
Optionally, use
includeto create a track DataFrame that contains the first trace event and all subsequent records for that entity. Additionally, the records for the entity of interest are always included in the output track DataFrame. These results are helpful for visualizing where entities travelled and can be used in the Reconstruct Tracks tool.Tracks Data Frame()
Limitations
The input proximity events must be a point DataFrame with a timestamp. Any records that do not have time are not included in the results.
When using proximity tracing to find transmission (such as a disease), be aware of the following:
-
The presence of a trace event does not guarantee that it has been transmitted; it is only a potential encounter.
-
The absence of a trace event does not mean that something hasn’t been transmitted. In cases such as a disease, there may be transmission through other vectors.
-
When possible, use
setto constrain proximity events when required. For example, use attributes to constrain the room, floor, or elevation.Attribute Match Criteria()
Results
The output proximity events DataFrame contains the first proximity event for the entities in the trace, as well as the following fields:
| Field | Description |
|---|---|
from | The upstream entity ID. |
to | The downstream entity ID. |
depth | The degree of separation between the entity of interest and the to_id field. |
duration | The duration of the trace event in minutes. This field is calculated as the difference between the start and end times and stored in seconds. A value of 0 means that there is a single proximity event (same start and end time are the same). |
entity | The entity ID. |
event | The date and time of the proximity event. This field is calculated as the first recorded time that meets the criteria of the proximity event. |
event | The geometry of the proximity event. |
The output tracks DataFrame includes the following fields:
| Field | Description |
|---|---|
entity | The entity ID. |
depth | The degree of separation between the entity of interest and the trace track. The depth is the same across a single track. |
instant | The timestamp of each record. This is the same date as the record from the input records. |
track | Points representing the locations of entities after each proximity event. |
track | The start time of the track. |
Similar Capabilities
Performance notes
Improve the performance of Trace Proximity Events by doing one or more of the following:
-
Only analyze the records in your area of interest. You can pick the records of interest by using one of the following SQL functions:
- ST_Intersection—Clip to an area of interest represented by a polygon. This will modify your input records.
- ST_BboxIntersects—Select records that intersect an envelope.
- ST_EnvIntersects—Select records having an evelope that intersects the envelope of another geometry.
- ST_Intersects—Select records that intersect another dataset or area of intersect represented by a polygon.
- Use smaller values for
setandSearch Distance() set.Search Duration() - Limit the entities of interest using the
set.Attribute Match Criteria() - Specify a
setvalue to limit the number of downstream traces for a given entity and the entity of interest.Maximum Trace Depth()
How Trace Proximity Events works
The diagrams below show how the Trace Proximity Events tool processes data. In these diagrams, time is on the x-axis. In each diagram there are four entities: A, B, C, and D. The highlighted text describes the trace events that occur between two entities (the from and to entities) and the depth of the proximity event. In this example, entity C is the entity of interest that is being traced downstream.
In diagram 1, entity C is the chosen entity of interest. The depth is 0.

In diagram 2, a proximity event occurs between entities C and B. The depth of the trace is 1. When multiple records are subsequent proximity events, this is a sustained proximity event.

In diagram 3, a proximity event occurs between entities B and A. The depth of the trace is 2.

In diagram 4, a proximity event occurs between entities C and D. The depth of the trace is 1.

In the image below, entity B is the entity of interest and comes in
proximity with entity A three times, denoted by the blue circles.
Assuming that time is on the x-axis, the first proximity event is 1,
followed by a break without contact, and then proximity events 2 and 3.
The tool returns event 1 in the proximity events DataFrame. Proximity
events 2 and 3 are not returned. If set is true, all
input rows after proximity event 1 are returned in the output tracks
DataFrame.

Syntax
For more details, go to the GeoAnalytics Engine API reference for trace proximity events.
| Setter (Python) | Setter (Scala) | Description | Required |
|---|---|---|---|
run(dataframe) | run(input) | Runs the Trace Proximity Events tool using the provided DataFrame. | Yes |
include | include | Includes a second DataFrame with the points used in the trace. | No |
set | set | One or more fields used to constrain the proximity events. Entities will only be considered near when the spatial search distance and temporal search distance criteria are met and the two entities have equal values of the fields specified. | No |
set | set | Sets the method used to calculate distances between track observations. There are two methods to choose from: ' or '. See Usage notes for the default option. | Required when track observations have projected coordinates. |
set | set | Sets one or more entities that you are interested in tracing from, as well as a time to start tracing from. | Yes |
set | set | Sets the field used to identify distinct entities. | Yes |
set | set | Sets the maximum degrees of separation between an entity of interest and an entity further down the trace. | No |
set | set | Sets the maximum distance between two points to be considered in proximity. Points closer together in space and that also meet the search duration criteria are considered in proximity of each other. | Yes |
set | set | Sets the maximum duration between two points that are considered in proximity. Points closer together in time and that also meet the search distance criteria are considered in proximity of each other. | Yes |
Examples
Run Trace Proximity Events
# Imports
from geoanalytics.tools import TraceProximityEvents
from geoanalytics.sql import functions as ST
from pyspark.sql import functions as F
# Path to the Seattle example tracks data
data_path = r"https://services1.arcgis.com/36PP9fe9l4BSnArw/arcgis/rest" \
"/services/seattle_example_tracks/FeatureServer/0"
# Create a DataFrame from the Seattle example tracks data
df = spark.read.format("feature-service").load(data_path)
# Use Trace Proximity Events to find records that are within proximity of each other
# by 50 feet with a 5 minute range and originating from user2 and user3.
result = TraceProximityEvents() \
.setEntityIdField(entity_id_field="user_id") \
.setEntitiesOfInterestIds(entities_of_interest_ids=
[{"entityId": "user2", "epochTimeStamp": 1585569600000},
{"entityId": "user3", "epochTimeStamp": 1585828800000}]) \
.setDistanceMethod(distance_method="Planar") \
.setSearchDuration(search_duration=5, search_duration_unit="Minutes") \
.setSearchDistance(search_distance=50, search_distance_unit="Feet") \
.includeTracksDataFrame() \
.run(dataframe=df)
# View the first 5 rows of the output proximity events to show where events occurred
result.output.select("from_id", "to_id", "duration_minutes", "depth", "event_geometry",
F.date_format("event_start", "yyyy-MM-dd").alias("event_start")) \
.sort("from_id", "to_id").show(5)
# View the first 5 rows of the tracksLayer to show travel after events occurred
result.tracks.select("entity_id", "depth", "track_geometry",
F.date_format("track_start", "yyyy-MM-dd").alias("track_start")).show(5)+-------+-----+----------------+-----+--------------------+-----------+
|from_id|to_id|duration_minutes|depth| event_geometry|event_start|
+-------+-----+----------------+-----+--------------------+-----------+
| NULL|user2| NULL| 0| NULL| 2020-03-30|
| NULL|user3| NULL| 0| NULL| 2020-04-02|
| user1|user4| 0.0| 2|{"x":1268471.8960...| 2020-04-01|
| user2|user1| 26.0| 1|{"x":1267840.5744...| 2020-03-30|
| user4|user5| 0.0| 3|{"x":1265728.4904...| 2020-04-01|
+-------+-----+----------------+-----+--------------------+-----------+
+---------+-----+--------------------+-----------+
|entity_id|depth| track_geometry|track_start|
+---------+-----+--------------------+-----------+
| user1| 1|{"x":1267840.4481...| 2020-03-30|
| user1| 1|{"x":1267744.6826...| 2020-03-30|
| user1| 1|{"x":1267705.5232...| 2020-03-30|
| user1| 1|{"x":1267726.8824...| 2020-03-30|
| user1| 1|{"x":1267836.5154...| 2020-03-30|
+---------+-----+--------------------+-----------+
only showing top 5 rowsPlot results
# Get the tracks for the users that have come into contact with each other
seattle_example_tracks_plot = df.where("user_id = 'user1' or user_id = 'user2'" \
"or user_id = 'user4' or user_id = 'user_id5'") \
.st.plot(color="purple", figsize=(14,8), basemap="light")
# Create a new column containing the "from to" information for the plot legend
output_df = result.output.withColumn("from_to", F.concat(F.lit("from "),"from_id",
F.lit(" to "), "to_id"))
# Plot the proximity events DataFrame
output_plot = output_df.st.plot(cmap_values="from_to",
is_categorical=True,
cmap="Paired",
s=100, legend=True,
legend_kwds={"title": "Proximity Events"},
ax=seattle_example_tracks_plot)
output_plot.set_title("Proximity events for users in Seattle example track data")
# Plot the Trace Proximity Events tracks DataFrame
tracks_plot = result.tracks.st.plot(cmap_values="entity_id",
is_categorical=True,
cmap="Paired", legend=True,
legend_kwds={"title": "User ID"},
figsize=(14,8), basemap="light")
tracks_plot.set_title("Tracks showing the travel of users following a proximity event")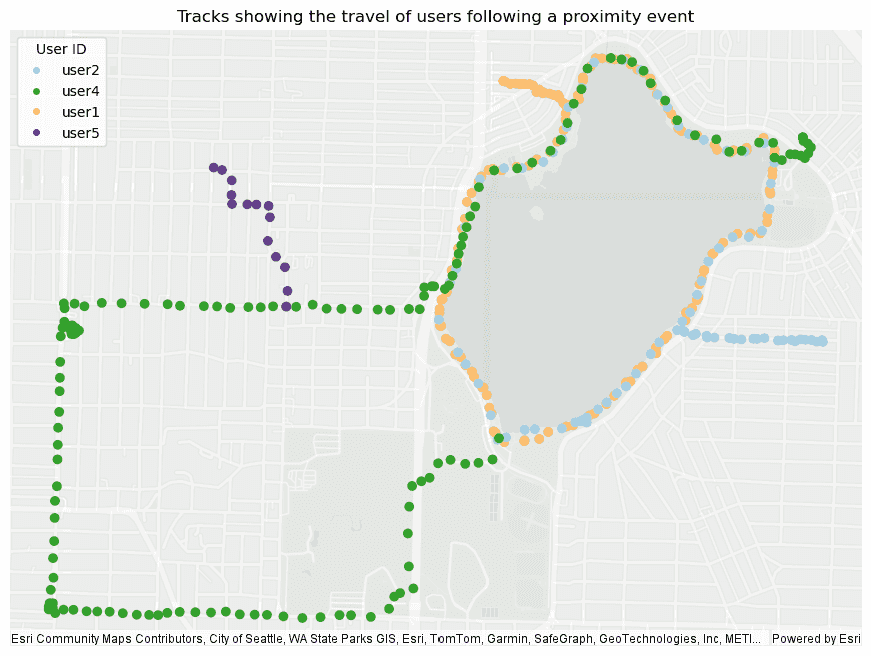
Version table
| Release | Notes |
|---|---|
1.0.0 | Python tool introduced |
1.6.0 | Scala tool introduced |