GeoEnrich enriches input polygons with demographic variables describing the people and places contained within those polygons.

A typical workflow involves first inspecting the available variables using the GeoEnrichVariables tool, once the appropriate variables have been identified, running the GeoEnrich tool with the selected variables.
Usage notes
- The input DataFrame must include exactly one polygon column.
- The polygons must have defined spatial reference.
- You can use a wildcard in
.setto retrieve multiple variables at once. See examples below for wildcard usage patterns.Variables() - Input polygons that are out of the spatial extent of the GeoEnrichment dataset will return
NULLon all selected variables. - The GeoEnrichment dataset must be accessible to all Spark cluster nodes. You can either copy the dataset to a node-local directory accessible to Spark, or use
Sparkto distribute files to Spark working directories. For environment-specific setup guidance, see GeoEnrichment dataset setup.Context.add File
Limitations
- GeoEnrich currently supports only Esri-provided datasets. User-provided datasets are not supported.
- Each ArcGIS GeoAnalytics Engine release is validated against its corresponding starter pack dataset version. Compatibility with earlier or later GeoEnrich Essentials dataset versions is not guaranteed.
- GeoEnrich in GeoAnalytics Engine only supports returning values using each variable's default calculation method (for example,
ACSAGEPFwill return the count of 2023 Female Populations (ACS 5-Yr).ACSMEDHINCwill return the median of household income).
Results
The output is the input DataFrame with one additional column for each selected GeoEnrichment variable.
Performance notes
- Use only the variables required for your analysis to reduce processing overhead and output width.
Syntax
For more details, go to the GeoAnalytics Engine API reference for GeoEnrich.
| Setter (Python) | Setter (Scala) | Description | Required |
|---|---|---|---|
run(dataframe) | run(input) | Runs the GeoEnrich tool using the input DataFrame. | Yes |
set | set | Sets the path to the dataset used by GeoEnrich. The dataset must be accessible on all Spark cluster nodes. | Yes |
set | set | Sets one or more GeoEnrichment variables to include in the output. | Yes |
Examples
Run GeoEnrich
# Imports
from geoanalytics.tools import GeoEnrich
usa_states_path = "https://services.arcgis.com/P3ePLMYs2RVChkJx/ArcGIS/rest/" \
"services/USA_State_Boundaries/FeatureServer/0"
df = spark.read.format("feature-service").load(usa_states_path)
data_path = r"/data/GeoEnrich_Essentials_for_ArcGIS_GeoAnalytics_Engine.biz"
result = GeoEnrich() \
.setDataPath(data_path) \
.setVariables("*AGEPF80") \
.run(df)
result.select("STATE_NAME", "ACSAGEPF80", "MOEAGEPF80", "RELAGEPF80").sort("STATE_NAME").show(5)Result
+----------+----------+----------+----------+
|STATE_NAME|ACSAGEPF80|MOEAGEPF80|RELAGEPF80|
+----------+----------+----------+----------+
| Alabama| 61144| 1948| 1.0|
| Alaska| 4133| 422| 1.0|
| Arizona| 87580| 2275| 1.0|
| Arkansas| 35845| 1398| 1.0|
|California| 382197| 4580| 1.0|
+----------+----------+----------+----------+
only showing top 5 rowsPlot results
# Imports
from geoanalytics.tools import GeoEnrich
usa_states_path = "https://services.arcgis.com/P3ePLMYs2RVChkJx/ArcGIS/rest/" \
"services/USA_State_Boundaries/FeatureServer/0"
df = spark.read.format("feature-service").load(usa_states_path)
data_path = r"/data/GeoEnrich_Essentials_for_ArcGIS_GeoAnalytics_Engine.biz"
result = GeoEnrich() \
.setDataPath(data_path) \
.setVariables("*AGEPF80") \
.run(df)
result.select("STATE_NAME", "ACSAGEPF80", "MOEAGEPF80", "RELAGEPF80").sort("STATE_NAME").show(5)Python
# Plot the GeoEnrich results
result_plot = result.st.plot(cmap_values="ACSAGEPF80",
legend=True,
cmap="YlOrRd",
figsize=(16,8),
basemap="light",
show_axis=True)
result_plot.set_title("Female Population Aged 80–84 by U.S. State (2023 ACS 5-Year Estimates)")
result_plot.set_xlabel("X (Meters)")
result_plot.set_ylabel("Y (Meters)");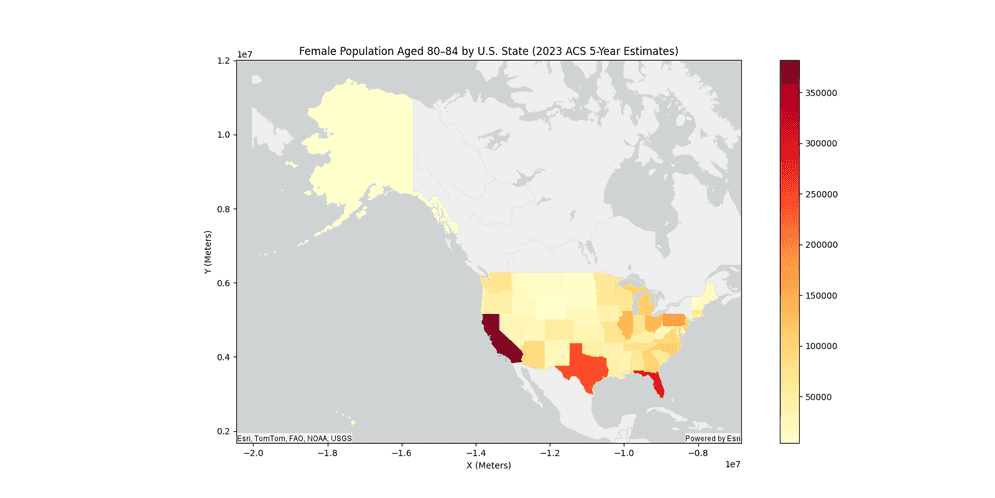
Version table
| Release | Notes |
|---|---|
2.1.0 | Python tool introduced |
2.1.0 | Scala tool introduced |