This sample demonstrates how you can use multiple LabelClass objects to create advanced label configurations for clusters and individual features. It also demonstrates how to configure a popupTemplate with various aggregate fields and expressions for summarizing features in each cluster.
Advanced labeling
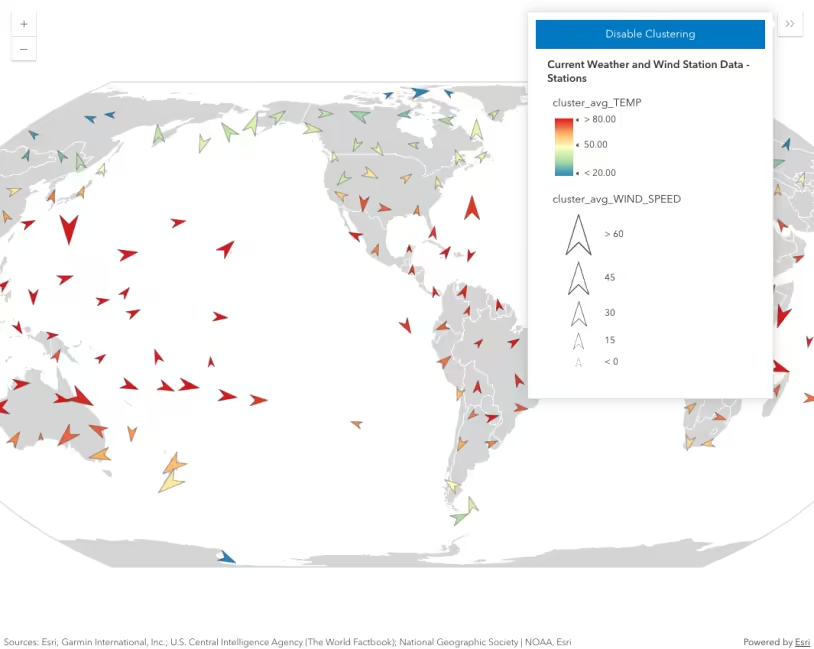
Cluster labels are defined as an array of LabelClass. See FeatureReductionCluster.labelingInfo for additional details.
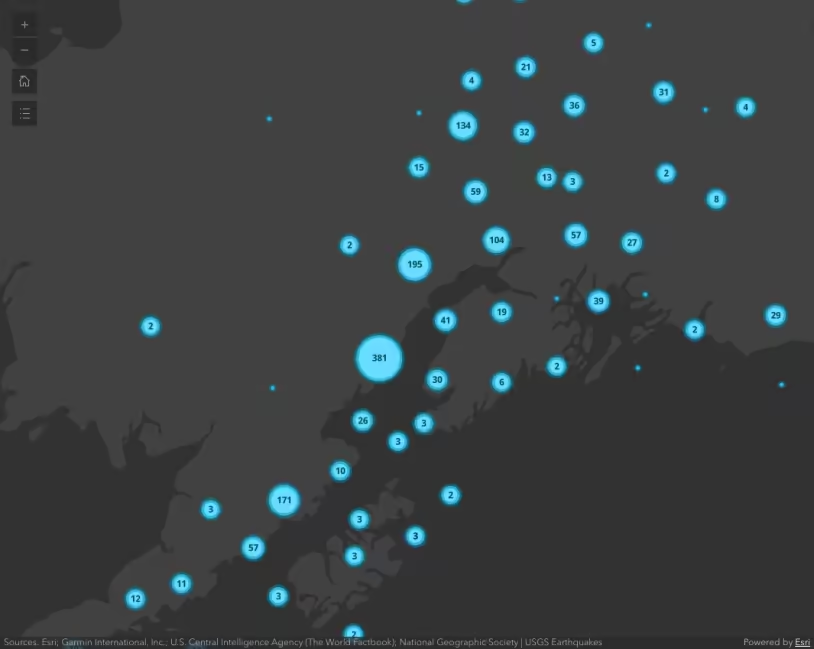
In most cases, you’ll set one LabelClass in the layer’s featureReduction property to convey information about the cluster. This typically involves displaying the total number of features within the center of the cluster.
layer.featureReduction = { type: "cluster", clusterRadius: "100px", clusterMinSize: "24px", clusterMaxSize: "60px", labelingInfo: [ { deconflictionStrategy: "none", labelExpressionInfo: { expression: "Text($feature.cluster_count, '#,###')", }, symbol: { type: "text", color: "#004a5d", font: { weight: "bold", family: "Noto Sans", size: "12px", }, }, labelPlacement: "center-center", }, ],};This sample demonstrates more advanced label configurations. Since all LabelClass properties are available to you in FeatureReductionCluster, you can change the expression, min/max scale, text/font properties, and filter to display various information about features in the cluster. Multiple Label classes with different where clauses can be used to define several labels with varying styles on the same feature. Likewise, multiple label classes may be used to label different types of clusters (e.g. blue labels for small clusters and red labels for large ones).
This sample uses the following suggested practices:
- Turn off label deconfliction when labeling clusters with a count in the center of the cluster. If label placement is outside the cluster, keep label deconfliction enabled.
- Increase the clusterMinSize to fit labels inside smaller clusters (16pt is a good starting point).
- If the layer has a size visual variable, increase the size of the smallest features to improve the cluster visualization.
- If multiple label classes are set on
featureReduction.labelingInfo, set matching label classes on thelayer.labelingInfo, especially when a size visual variable is included in the renderer. This helps the end user differentiate between clusters and individual features.
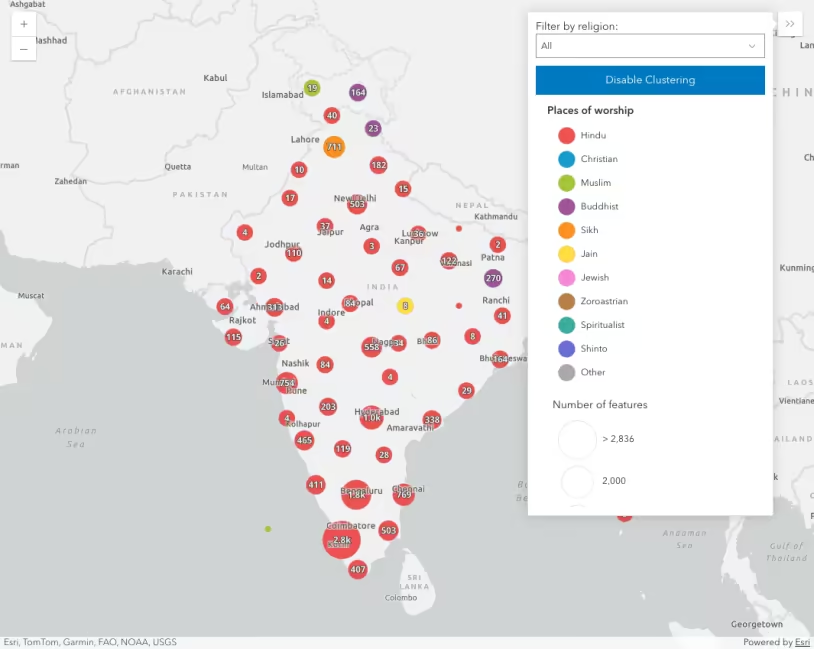
Filtering
This sample also demonstrates how to use a slider to explore and filter a layer while clustering is enabled in a Map component.
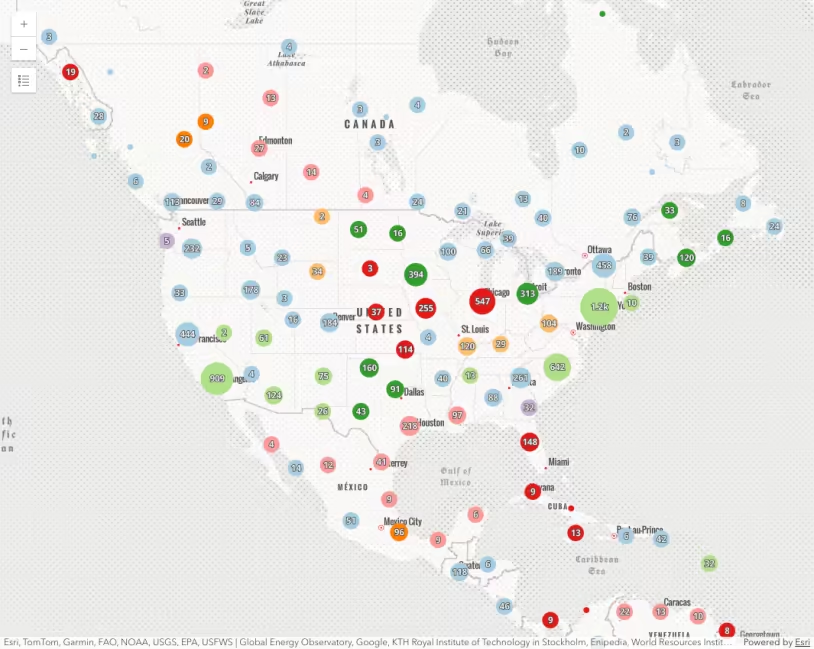
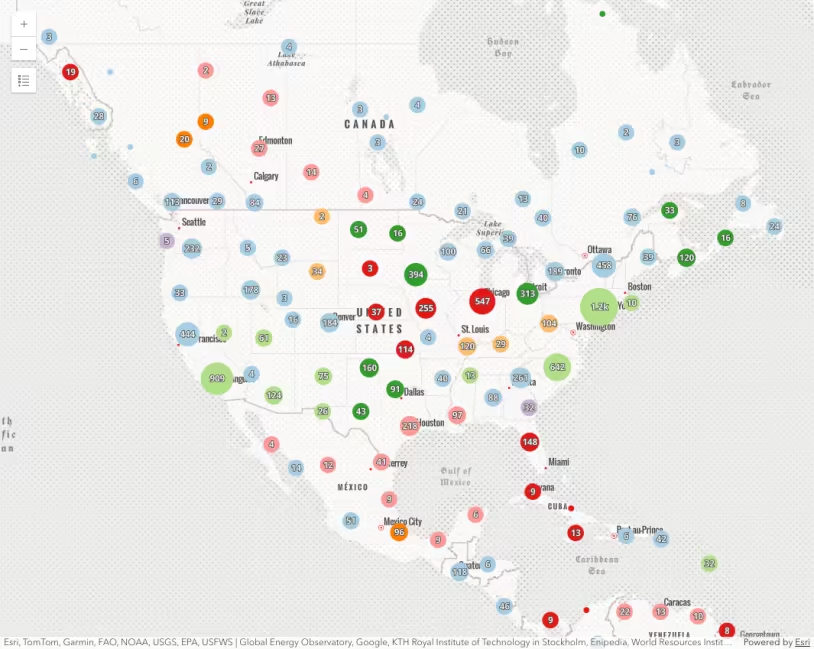
The layer in this sample visualizes global power plants with a UniqueValueRenderer. When clustering is enabled, each cluster is assigned the symbol of the most common uniqueValueInfo among the features in the cluster.
Filters on clustered layer views filter the underlying features and recompute the clusters client-side. The updated clusters only display information complying with the filter including the number of features and the predominant category of the renderer, in this case fuel type.
Because the FeatureLayerView renders using the GPU, rendering and filtering updates happen quickly so you can update a filter as the user slides a slider thumb.
<calcite-slider value="0" min="0" max="2000" label-handles label-ticks max-label="2000" min-label="0" ticks="2000"></calcite-slider>// filter features by power plant capacity when the user drags the slider thumb.// If clustering is enabled, clusters will recompute and render based on the number// and type of features that satisfy the filter where clauseconst slider = document.querySelector("calcite-slider");slider.addEventListener("calciteSliderChange", (event) => { document.getElementById("sliderValue").innerHTML = `<b>${slider.value}</b>`; layerView.filter = { where: `${field} >= ${slider.value}`, };});Related samples and resources
Intro to clustering
Clustering - generate suggested configuration
Clustering - query clusters
Clustering - filter popup features
Popup charts for clusters