Perform an exploratory viewshed analysis from a defined vantage point.
Use case
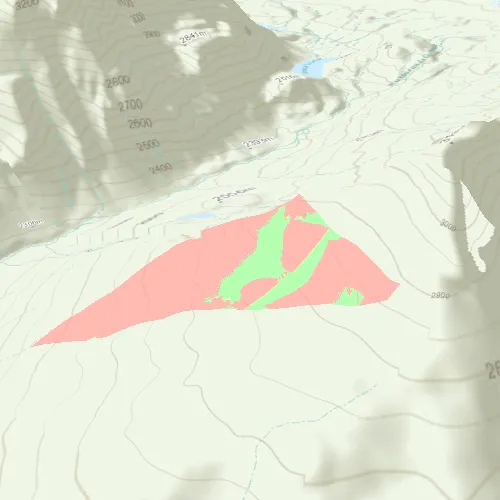
An exploratory viewshed analysis is a type of visual analysis you can perform at the current rendered resolution of a scene. The exploratory viewshed shows what can be seen from a given location. The output is an overlay with two different colors - one representing the visible areas (green) and the other representing the obstructed areas (red).
Note: This analysis is a form of “exploratory analysis”, which means the results are calculated on the current scale of the data, and the results are generated very quickly but not persisted. If persisted analysis performed at the full resolution of the data is required, consider using a ViewshedFunction to perform a viewshed calculation instead.
How to use the sample
Use the sliders to change the properties (heading, pitch, etc.), of the exploratory viewshed and see them updated in real time. To move the exploratory viewshed, double touch and drag your finger across the screen. Lift your finger to stop moving the exploratory viewshed.
How it works
- Create a
ExploratoryLocationViewshedpassing in the observer location, heading, pitch, horizontal/vertical angles, and min/max distances. - Set the property values on the exploratory viewshed instance for location, direction, range, and visibility properties.
Relevant API
- AnalysisOverlay
- ArcGISSceneLayer
- ArcGISTiledElevationSource
- ExploratoryLocationViewshed
About the data
The scene shows a buildings layer in Brest, France hosted on ArcGIS Online.
Tags
3D, exploratory viewshed, frustum, scene, visibility analysis
Sample code
// [WriteFile Name=ShowExploratoryViewshedFromPointInScene, Category=Analysis]// [Legal]// Copyright 2017 Esri.//// Licensed under the Apache License, Version 2.0 (the "License");// you may not use this file except in compliance with the License.// You may obtain a copy of the License at// http://www.apache.org/licenses/LICENSE-2.0//// Unless required by applicable law or agreed to in writing, software// distributed under the License is distributed on an "AS IS" BASIS,// WITHOUT WARRANTIES OR CONDITIONS OF ANY KIND, either express or implied.// See the License for the specific language governing permissions and// limitations under the License.// [Legal]
#ifdef PCH_BUILD#include "pch.hpp"#endif // PCH_BUILD
// sample headers#include "ShowExploratoryViewshedFromPointInScene.h"
// ArcGIS Maps SDK headers#include "AnalysisListModel.h"#include "AnalysisOverlay.h"#include "AnalysisOverlayListModel.h"#include "ArcGISTiledElevationSource.h"#include "Camera.h"#include "ElevationSourceListModel.h"#include "ExploratoryLocationViewshed.h"#include "MapTypes.h"#include "Point.h"#include "Scene.h"#include "SceneQuickView.h"#include "SpatialReference.h"#include "Surface.h"
// Qt headers#include <QFuture>
using namespace Esri::ArcGISRuntime;
ShowExploratoryViewshedFromPointInScene::ShowExploratoryViewshedFromPointInScene(QQuickItem* parent /* = nullptr */) :  QQuickItem(parent){}
void ShowExploratoryViewshedFromPointInScene::init(){  // Register classes for QML  qmlRegisterType<SceneQuickView>("Esri.Samples", 1, 0, "SceneView");  qmlRegisterType<ShowExploratoryViewshedFromPointInScene>("Esri.Samples", 1, 0, "ShowExploratoryViewshedFromPointInSceneSample");}
void ShowExploratoryViewshedFromPointInScene::componentComplete(){  QQuickItem::componentComplete();
  // Create a scene and give it to the SceneView  m_sceneView = findChild<SceneQuickView*>("sceneView");
  Scene* scene = new Scene(BasemapStyle::ArcGISTopographic, this);  Surface* surface = new Surface(this);  surface->elevationSources()->append(    new ArcGISTiledElevationSource(QUrl("https://elevation3d.arcgis.com/arcgis/rest/services/WorldElevation3D/Terrain3D/ImageServer"), this));  scene->setBaseSurface(surface);  m_sceneView->setArcGISScene(scene);
  // Add an Analysis Overlay  m_analysisOverlay = new AnalysisOverlay(this);  m_sceneView->analysisOverlays()->append(m_analysisOverlay);
  // set initial viewpoint  setInitialViewpoint();
  // connect signals  connectSignals();}
void ShowExploratoryViewshedFromPointInScene::setInitialViewpoint(){  // Set a viewpoint  double x = 6.86088;  double y = 45.3604;  double z = 3582.55;  Point point(x, y, z, SpatialReference(4326));  double heading = 345;  double pitch = 70;  double roll = 0;  Camera camera(point, heading, pitch, roll);  m_sceneView->setViewpointCameraAsync(camera);}
void ShowExploratoryViewshedFromPointInScene::connectSignals(){  // on mouse click perform the location viewshed  connect(m_sceneView, &SceneQuickView::mouseClicked, this, [this](QMouseEvent& event)  {    if (!m_locationViewshed)    {      createViewshed(event.position().x(), event.position().y());    }    else    {      const Point pt = m_sceneView->screenToBaseSurface(event.position().x(), event.position().y());      m_locationViewshed->setLocation(pt);    }  });
  connect(m_sceneView, &SceneQuickView::mousePressedAndHeld, this, [this](QMouseEvent& event)  {    if (!m_locationViewshed)    {      createViewshed(event.position().x(), event.position().y());    }
    m_calculating = true;  });
  connect(m_sceneView, &SceneQuickView::mouseMoved, this, [this](QMouseEvent& event)  {    if (m_calculating)    {      const Point pt = m_sceneView->screenToBaseSurface(event.position().x(), event.position().y());      m_locationViewshed->setLocation(pt);    }  });
  connect(m_sceneView, &SceneQuickView::mouseReleased, this, [this]  {    m_calculating = false;  });}
void ShowExploratoryViewshedFromPointInScene::createViewshed(double x, double y){  const Point pt = m_sceneView->screenToBaseSurface(x, y);
  // Create the Location Viewshed  m_locationViewshed =    new ExploratoryLocationViewshed(pt, m_heading, m_pitch, m_horizontalAngle, m_veriticalAngle, m_minDistance, m_maxDistance, this);  m_locationViewshed->setVisible(m_viewshedVisible);
  // Add the Viewshed to the Analysis Overlay  m_analysisOverlay->analyses()->append(m_locationViewshed);
  return;}
// Getters/Setters for each Q_PROPERTYbool ShowExploratoryViewshedFromPointInScene::isViewshedVisible() const{  return m_viewshedVisible;}
void ShowExploratoryViewshedFromPointInScene::setViewshedVisible(bool viewshedVisible){  if (m_locationViewshed)  {    if (m_locationViewshed->isVisible() == viewshedVisible)    {      return;    }
    m_viewshedVisible = viewshedVisible;    m_locationViewshed->setVisible(viewshedVisible);  }  else  {    if (m_viewshedVisible == viewshedVisible)    {      return;    }
    m_viewshedVisible = viewshedVisible;  }
  emit viewshedVisibleChanged();}
bool ShowExploratoryViewshedFromPointInScene::isFrustumOutlineVisible() const{  return m_locationViewshed ? m_locationViewshed->isFrustumOutlineVisible() : m_frustumVisible;}
void ShowExploratoryViewshedFromPointInScene::setFrustumOutlineVisible(bool frustumVisible){  if (m_locationViewshed)  {    if (m_locationViewshed->isFrustumOutlineVisible() == frustumVisible)    {      return;    }
    m_frustumVisible = frustumVisible;    m_locationViewshed->setFrustumOutlineVisible(frustumVisible);  }  else  {    if (m_frustumVisible == frustumVisible)    {      return;    }
    m_frustumVisible = frustumVisible;  }
  emit frustumVisibleChanged();}
double ShowExploratoryViewshedFromPointInScene::minDistance() const{  return m_locationViewshed ? m_locationViewshed->minDistance() : m_minDistance;}
void ShowExploratoryViewshedFromPointInScene::setMinDistance(double minDistance){  if (m_locationViewshed)  {    if (m_locationViewshed->minDistance() == minDistance)    {      return;    }
    m_minDistance = minDistance;    m_locationViewshed->setMinDistance(minDistance);  }  else  {    if (m_minDistance == minDistance)    {      return;    }
    m_minDistance = minDistance;  }
  emit minDistanceChanged();}
double ShowExploratoryViewshedFromPointInScene::maxDistance() const{  return m_locationViewshed ? m_locationViewshed->maxDistance() : m_maxDistance;}
void ShowExploratoryViewshedFromPointInScene::setMaxDistance(double maxDistance){  m_maxDistance = maxDistance;
  if (m_locationViewshed)  {    if (m_locationViewshed->maxDistance() == maxDistance)    {      return;    }
    m_maxDistance = maxDistance;    m_locationViewshed->setMaxDistance(maxDistance);  }  else  {    if (m_maxDistance == maxDistance)    {      return;    }
    m_maxDistance = maxDistance;  }
  emit maxDistanceChanged();}
double ShowExploratoryViewshedFromPointInScene::horizontalAngle() const{  return m_locationViewshed ? m_locationViewshed->horizontalAngle() : m_horizontalAngle;}
void ShowExploratoryViewshedFromPointInScene::setHorizontalAngle(double horizontalAngle){  if (m_locationViewshed)  {    if (m_locationViewshed->horizontalAngle() == horizontalAngle)    {      return;    }
    m_horizontalAngle = horizontalAngle;    m_locationViewshed->setHorizontalAngle(horizontalAngle);  }  else  {    if (m_horizontalAngle == horizontalAngle)    {      return;    }
    m_horizontalAngle = horizontalAngle;  }
  emit horizontalAngleChanged();}
double ShowExploratoryViewshedFromPointInScene::verticalAngle() const{  return m_locationViewshed ? m_locationViewshed->verticalAngle() : m_veriticalAngle;}
void ShowExploratoryViewshedFromPointInScene::setVerticalAngle(double verticalAngle){  if (m_locationViewshed)  {    if (m_locationViewshed->verticalAngle() == verticalAngle)    {      return;    }
    m_veriticalAngle = verticalAngle;    m_locationViewshed->setVerticalAngle(verticalAngle);  }  else  {    if (m_veriticalAngle == verticalAngle)    {      return;    }
    m_veriticalAngle = verticalAngle;  }
  emit verticalAngleChanged();}
double ShowExploratoryViewshedFromPointInScene::heading() const{  return m_locationViewshed ? m_locationViewshed->heading() : m_heading;}
void ShowExploratoryViewshedFromPointInScene::setHeading(double heading){  if (m_locationViewshed)  {    if (m_locationViewshed->heading() == heading)    {      return;    }
    m_heading = heading;    m_locationViewshed->setHeading(heading);  }  else  {    if (m_heading == heading)    {      return;    }
    m_heading = heading;  }
  emit headingChanged();}
double ShowExploratoryViewshedFromPointInScene::pitch() const{  return m_locationViewshed ? m_locationViewshed->pitch() : m_pitch;}
void ShowExploratoryViewshedFromPointInScene::setPitch(double pitch){  if (m_locationViewshed)  {    if (m_locationViewshed->pitch() == pitch)    {      return;    }
    m_pitch = pitch;    m_locationViewshed->setPitch(pitch);  }  else  {    if (m_pitch == pitch)    {      return;    }
    m_pitch = pitch;  }
  emit pitchChanged();}
QColor ShowExploratoryViewshedFromPointInScene::visibleColor() const{  return ExploratoryLocationViewshed::visibleColor();}
void ShowExploratoryViewshedFromPointInScene::setVisibleColor(const QColor& visibleColor){  if (ExploratoryLocationViewshed::visibleColor() == visibleColor)  {    return;  }
  ExploratoryLocationViewshed::setVisibleColor(visibleColor);
  emit visibleColorChanged();}
QColor ShowExploratoryViewshedFromPointInScene::obstructedColor() const{  return ExploratoryLocationViewshed::obstructedColor();}
void ShowExploratoryViewshedFromPointInScene::setObstructedColor(const QColor& obstructedColor){  if (ExploratoryLocationViewshed::obstructedColor() == obstructedColor)  {    return;  }
  ExploratoryLocationViewshed::setObstructedColor(obstructedColor);
  emit obstructedColorChanged();}
// [WriteFile Name=ShowExploratoryViewshedFromPointInScene, Category=Analysis]// [Legal]// Copyright 2017 Esri.//// Licensed under the Apache License, Version 2.0 (the "License");// you may not use this file except in compliance with the License.// You may obtain a copy of the License at// http://www.apache.org/licenses/LICENSE-2.0//// Unless required by applicable law or agreed to in writing, software// distributed under the License is distributed on an "AS IS" BASIS,// WITHOUT WARRANTIES OR CONDITIONS OF ANY KIND, either express or implied.// See the License for the specific language governing permissions and// limitations under the License.// [Legal]
#ifndef ShowExploratoryViewshedFromPointInScene_H#define ShowExploratoryViewshedFromPointInScene_H
// Qt headers#include <QColor>#include <QQuickItem>
namespace Esri::ArcGISRuntime{ class SceneQuickView; class ExploratoryLocationViewshed; class AnalysisOverlay;} // namespace Esri::ArcGISRuntime
class ShowExploratoryViewshedFromPointInScene : public QQuickItem{ Q_OBJECT
public: explicit ShowExploratoryViewshedFromPointInScene(QQuickItem* parent = nullptr); ~ShowExploratoryViewshedFromPointInScene() override = default;
void componentComplete() override; static void init();
Q_PROPERTY(bool viewshedVisible READ isViewshedVisible WRITE setViewshedVisible NOTIFY viewshedVisibleChanged) Q_PROPERTY(bool frustumVisible READ isFrustumOutlineVisible WRITE setFrustumOutlineVisible NOTIFY frustumVisibleChanged) Q_PROPERTY(double minDistance READ minDistance WRITE setMinDistance NOTIFY minDistanceChanged) Q_PROPERTY(double maxDistance READ maxDistance WRITE setMaxDistance NOTIFY maxDistanceChanged) Q_PROPERTY(double horizontalAngle READ horizontalAngle WRITE setHorizontalAngle NOTIFY horizontalAngleChanged) Q_PROPERTY(double verticalAngle READ verticalAngle WRITE setVerticalAngle NOTIFY verticalAngleChanged) Q_PROPERTY(double heading READ heading WRITE setHeading NOTIFY headingChanged) Q_PROPERTY(double pitch READ pitch WRITE setPitch NOTIFY pitchChanged) Q_PROPERTY(QColor visibleColor READ visibleColor WRITE setVisibleColor NOTIFY visibleColorChanged) Q_PROPERTY(QColor obstructedColor READ obstructedColor WRITE setObstructedColor NOTIFY obstructedColorChanged)
bool isViewshedVisible() const; void setViewshedVisible(bool viewshedVisible);
bool isFrustumOutlineVisible() const; void setFrustumOutlineVisible(bool frustumVisible);
double minDistance() const; void setMinDistance(double minDistance);
double maxDistance() const; void setMaxDistance(double maxDistance);
double horizontalAngle() const; void setHorizontalAngle(double horizontalAngle);
double verticalAngle() const; void setVerticalAngle(double verticalAngle);
double heading() const; void setHeading(double heading);
double pitch() const; void setPitch(double pitch);
QColor visibleColor() const; void setVisibleColor(const QColor& visibleColor);
QColor obstructedColor() const; void setObstructedColor(const QColor& obstructedColor);
signals: void viewshedVisibleChanged(); void frustumVisibleChanged(); void minDistanceChanged(); void maxDistanceChanged(); void horizontalAngleChanged(); void verticalAngleChanged(); void headingChanged(); void pitchChanged(); void visibleColorChanged(); void obstructedColorChanged();
private: void connectSignals(); void setInitialViewpoint(); void createViewshed(double x, double y);
Esri::ArcGISRuntime::SceneQuickView* m_sceneView = nullptr; Esri::ArcGISRuntime::ExploratoryLocationViewshed* m_locationViewshed = nullptr; Esri::ArcGISRuntime::AnalysisOverlay* m_analysisOverlay = nullptr;
bool m_viewshedVisible = true; bool m_frustumVisible = false; double m_minDistance = 50; double m_maxDistance = 1000; double m_horizontalAngle = 45; double m_veriticalAngle = 90; double m_heading = 0; double m_pitch = 90; bool m_calculating = false;};
#endif // ShowExploratoryViewshedFromPointInScene_H// [WriteFile Name=ViewshedLocation, Category=Analysis]// [Legal]// Copyright 2018 Esri.//// Licensed under the Apache License, Version 2.0 (the "License");// you may not use this file except in compliance with the License.// You may obtain a copy of the License at// http://www.apache.org/licenses/LICENSE-2.0//// Unless required by applicable law or agreed to in writing, software// distributed under the License is distributed on an "AS IS" BASIS,// WITHOUT WARRANTIES OR CONDITIONS OF ANY KIND, either express or implied.// See the License for the specific language governing permissions and// limitations under the License.// [Legal]
import QtQuickimport QtQuick.Controlsimport QtQuick.Layouts
Dialog { id: colorDialog property alias red: redSlider.value property alias green: greenSlider.value property alias blue: blueSlider.value property alias alpha: alphaSlider.value readonly property color color: Qt.rgba(red, green, blue, alpha);
title: qsTr("Pick a color") standardButtons: Dialog.Ok | Dialog.Cancel
function setColor(c) { red = c.r; green = c.g; blue = c.b; alpha = c.a; }
GridLayout { columns: 2 Rectangle { Layout.columnSpan: 2 Layout.fillWidth: true height: redSlider.height border { color: "black" width: 1 } radius: 2 color: colorDialog.color }
Label { text: qsTr("Red") }
Slider { id: redSlider }
Label { text: qsTr("Green") }
Slider { id: greenSlider }
Label { text: qsTr("Blue") }
Slider { id: blueSlider }
Label { text: qsTr("Alpha") }
Slider { id: alphaSlider } }}// [WriteFile Name=ViewshedLocation, Category=Analysis]// [Legal]// Copyright 2017 Esri.//// Licensed under the Apache License, Version 2.0 (the "License");// you may not use this file except in compliance with the License.// You may obtain a copy of the License at// http://www.apache.org/licenses/LICENSE-2.0//// Unless required by applicable law or agreed to in writing, software// distributed under the License is distributed on an "AS IS" BASIS,// WITHOUT WARRANTIES OR CONDITIONS OF ANY KIND, either express or implied.// See the License for the specific language governing permissions and// limitations under the License.// [Legal]
import QtQuickimport QtQuick.Controls
Column { id: root width: parent.width spacing: 5
property string titleText property real parameterValue property real minValue: 1 property real maxValue: 179
Label { width: 80 text: titleText font.pixelSize: 14 }
Row { width: parent.width height: 25 spacing: 5
Slider { anchors.verticalCenter: parent.verticalCenter orientation: Qt.Horizontal from: minValue to: maxValue width: parent.width * 0.75 value: parameterValue
onValueChanged: { parameterValue = value; } }
Label { anchors.verticalCenter: parent.verticalCenter horizontalAlignment: Text.AlignRight text: Math.round(parameterValue) font.pixelSize: 14 } }}// [WriteFile Name=ShowExploratoryViewshedFromPointInScene, Category=Analysis]// [Legal]// Copyright 2017 Esri.//// Licensed under the Apache License, Version 2.0 (the "License");// you may not use this file except in compliance with the License.// You may obtain a copy of the License at// http://www.apache.org/licenses/LICENSE-2.0//// Unless required by applicable law or agreed to in writing, software// distributed under the License is distributed on an "AS IS" BASIS,// WITHOUT WARRANTIES OR CONDITIONS OF ANY KIND, either express or implied.// See the License for the specific language governing permissions and// limitations under the License.// [Legal]
import QtQuickimport QtQuick.Controlsimport QtQuick.Windowimport Esri.Samples
ShowExploratoryViewshedFromPointInSceneSample { id: viewshedSample clip: true width: 800 height: 600
SceneView { id: sceneView objectName: "sceneView" anchors.fill: parent
Component.onCompleted: { // Set the focus on SceneView to initially enable keyboard navigation forceActiveFocus(); }
ToolButton { anchors { right: parent.right bottom: sceneView.attributionTop margins: 10 } display: AbstractButton.IconOnly visible: !optionPanel.visible width: 45 height: 45 padding: 0 icon { source: "qrc:/Samples/Analysis/ShowExploratoryViewshedFromPointInScene/gear-24.svg" width: 32 height: 32 color: hovered ? palette.buttonText : palette.text } onClicked: optionPanel.visible = true
background: Rectangle { implicitWidth: 45 implicitHeight: 45 color: parent.hovered ? palette.highlight : palette.base radius: 25 } }
Rectangle { id: optionPanel anchors { right: parent.right top: parent.top bottom: sceneView.attributionTop } width: 260 visible: false color: palette.base opacity: 0.9
MouseArea { anchors.fill: parent acceptedButtons: Qt.LeftButton | Qt.RightButton onClicked: mouse => mouse.accepted = true onDoubleClicked: mouse => mouse.accepted = true onWheel: wheel => wheel.accepted = true }
Flickable { anchors { fill: parent margins: 5 } contentWidth: parent.width contentHeight: parent.height flickableDirection: Flickable.VerticalFlick
Column { id: optionColumn spacing: 10 width: optionPanel.width
Item { width: parent.width height: 25
Label { text: qsTr("Viewshed Options") anchors.horizontalCenter: parent.horizontalCenter font.pixelSize: 18 font.underline: true
}
ToolButton { anchors { right: parent.right rightMargin: 8 verticalCenter: parent.verticalCenter } padding: 0 display: AbstractButton.IconOnly icon { source: "qrc:/Samples/Analysis/ShowExploratoryViewshedFromPointInScene/x-24.svg" width: 32 height: 32 color: hovered ? palette.buttonText : palette.text } onClicked: optionPanel.visible = false
background: Rectangle { implicitWidth: 32 implicitHeight: 32 color: parent.hovered ? palette.highlight : "transparent" radius: 10 } } }
Item { width: parent.width height: 25
Label { anchors.verticalCenter: parent.verticalCenter width: parent.width * 0.75 text: qsTr("Viewshed Visible") font.pixelSize: 14 }
Switch { anchors { right: parent.right margins: 10 verticalCenter: parent.verticalCenter } checked: true onCheckedChanged: viewshedSample.viewshedVisible = checked; } }
Item { width: parent.width height: 25
Label { anchors.verticalCenter: parent.verticalCenter width: parent.width * 0.75 text: qsTr("Frustum Outline Visible") font.pixelSize: 14 }
Switch { anchors { right: parent.right margins: 10 verticalCenter: parent.verticalCenter } checked: false onCheckedChanged: viewshedSample.frustumVisible = checked; } }
ViewshedSlider { titleText: qsTr("Min Distance (m)") parameterValue: viewshedSample.minDistance minValue: 1 maxValue: 2000 onParameterValueChanged: viewshedSample.minDistance = parameterValue; }
ViewshedSlider { titleText: qsTr("Max Distance (m)") parameterValue: viewshedSample.maxDistance minValue: 1 maxValue: 2000 onParameterValueChanged: viewshedSample.maxDistance = parameterValue; }
ViewshedSlider { titleText: qsTr("Vertical Angle") parameterValue: viewshedSample.verticalAngle minValue: 1 maxValue: 120 onParameterValueChanged: viewshedSample.verticalAngle = parameterValue; }
ViewshedSlider { titleText: qsTr("Horizontal Angle") parameterValue: viewshedSample.horizontalAngle minValue: 1 maxValue: 120 onParameterValueChanged: viewshedSample.horizontalAngle = parameterValue; }
ViewshedSlider { titleText: qsTr("Heading") parameterValue: viewshedSample.heading minValue: 1 maxValue: 359 onParameterValueChanged: viewshedSample.heading = parameterValue; }
ViewshedSlider { titleText: qsTr("Pitch") parameterValue: viewshedSample.pitch minValue: 1 maxValue: 179 onParameterValueChanged: viewshedSample.pitch = parameterValue; }
Row { width: parent.width height: 25 spacing: 5
Label { anchors.verticalCenter: parent.verticalCenter width: parent.width * 0.75 text: qsTr("Visible Color") font.pixelSize: 14 }
Rectangle { anchors { margins: 10 verticalCenter: parent.verticalCenter } width: 25 height: width border { color: "black" width: 1 } color: viewshedSample.visibleColor radius: 4
MouseArea { anchors.fill: parent onClicked: { visibleColorDialog.open(); } } } }
Row { width: parent.width height: 25 spacing: 5
Label { anchors.verticalCenter: parent.verticalCenter width: parent.width * 0.75 text: qsTr("Obstructed Color") font.pixelSize: 14 }
Rectangle { anchors { margins: 10 verticalCenter: parent.verticalCenter } width: 25 height: width border { color: "black" width: 1 } color: viewshedSample.obstructedColor radius: 4
MouseArea { anchors.fill: parent onClicked: { obstructedColorDialog.open(); } } } } } } } }
ColorDialog { id: visibleColorDialog modal: true x: Math.round(parent.width - width) / 2 y: Math.round(parent.height - height) / 2 onAccepted: { viewshedSample.visibleColor = visibleColorDialog.color; } onOpened: { setColor(viewshedSample.visibleColor); } }
ColorDialog { id: obstructedColorDialog modal: true x: Math.round(parent.width - width) / 2 y: Math.round(parent.height - height) / 2 onAccepted: { viewshedSample.obstructedColor = obstructedColorDialog.color; } onOpened: { setColor(viewshedSample.obstructedColor); } }}