Query a table to get aggregated statistics back for a specific field.
Use case
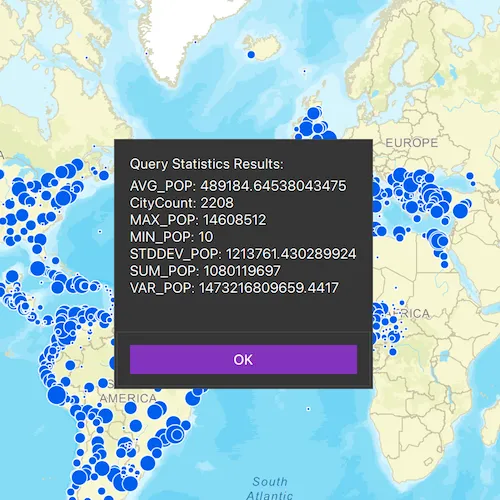
For example, a county boundaries table with population information can be queried to return aggregated results for total, average, maximum, and minimum population, rather than downloading the values for every county and calculating statistics manually.
How to use the sample
Pan and zoom to define the extent for the query. Use the ‘Cities in current extent’ checkbox to control whether the query only includes features in the visible extent. Use the ‘Cities grater than 5M’ checkbox to filter the results to only those cities with a population greater than 5 million people. Click ‘Get statistics’ to perform the query. The query will return population-based statistics from the combined results of all features matching the query criteria.
How it works
- Create a
ServiceFeatureTablewith a URL to the feature service. - Create
StatisticsQueryParameters, andStatisticDefinitionobjects, and add to the parameters. - Execute
queryStatisticsAsyncon theServiceFeatureTable. Depending on the state of the two checkboxes, additional parameters are set. - Display each
StatisticRecordin the first returnedQueryStatisticsResult.
Relevant API
- QueryParameters
- ServiceFeatureTable
- StatisticDefinition
- StatisticRecord
- StatisticsQueryParameters
- StatisticsQueryResult
- StatisticType
Tags
analysis, average, bounding geometry, filter, intersect, maximum, mean, minimum, query, spatial query, standard deviation, statistics, sum, variance
Sample code
// [WriteFile Name=StatisticalQuery, Category=Analysis]// [Legal]// Copyright 2017 Esri.//// Licensed under the Apache License, Version 2.0 (the "License");// you may not use this file except in compliance with the License.// You may obtain a copy of the License at// http://www.apache.org/licenses/LICENSE-2.0//// Unless required by applicable law or agreed to in writing, software// distributed under the License is distributed on an "AS IS" BASIS,// WITHOUT WARRANTIES OR CONDITIONS OF ANY KIND, either express or implied.// See the License for the specific language governing permissions and// limitations under the License.// [Legal]
#ifdef PCH_BUILD#include "pch.hpp"#endif // PCH_BUILD
// sample headers#include "StatisticalQuery.h"
// ArcGIS Maps SDK headers#include "CoreTypes.h"#include "Error.h"#include "FeatureLayer.h"#include "Geometry.h"#include "LayerListModel.h"#include "Map.h"#include "MapQuickView.h"#include "MapTypes.h"#include "ServiceFeatureTable.h"#include "StatisticDefinition.h"#include "StatisticRecord.h"#include "StatisticRecordIterator.h"#include "StatisticsQueryParameters.h"#include "StatisticsQueryResult.h"#include "Viewpoint.h"
// Qt headers#include <QFuture>#include <QUrl>#include <QUuid>
// STL headers#include <memory>
using namespace Esri::ArcGISRuntime;
StatisticalQuery::StatisticalQuery(QQuickItem* parent /* = nullptr */) :  QQuickItem(parent){}
void StatisticalQuery::init(){  // Register the map view for QML  qmlRegisterType<MapQuickView>("Esri.Samples", 1, 0, "MapView");  qmlRegisterType<StatisticalQuery>("Esri.Samples", 1, 0, "StatisticalQuerySample");}
void StatisticalQuery::componentComplete(){  QQuickItem::componentComplete();
  // find QML MapView component  m_mapView = findChild<MapQuickView*>("mapView");
  // Create a new Map with the world streets vector basemap  m_map = new Map(BasemapStyle::ArcGISStreets, this);
  // Create feature table using the world cities URL  m_featureTable = new ServiceFeatureTable(QUrl("https://sampleserver6.arcgisonline.com/arcgis/rest/services/SampleWorldCities/MapServer/0"), this);
  // Create a new feature layer to display features in the world cities table  FeatureLayer* featureLayer = new FeatureLayer(m_featureTable, this);  m_map->operationalLayers()->append(featureLayer);
  // Set map to map view  m_mapView->setMap(m_map);
  connect(m_featureTable, &ServiceFeatureTable::errorOccurred, this, [this](const Error& e)  {    if (e.isEmpty())    {      return;    }
    emit showStatistics(e.message());  });}
void StatisticalQuery::onQueryStatisticsCompleted_(StatisticsQueryResult* rawResult){  if (!rawResult)  {    return;  }
  // Delete rawResult when we leave local scope.  auto result = std::unique_ptr<StatisticsQueryResult>(rawResult);
  // Iterate through the results  QObject parent;  QString resultText;  StatisticRecordIterator iter = result->iterator();  while (iter.hasNext())  {    StatisticRecord* record = iter.next(&parent);    const QVariantMap& statsMap = record->statistics();    for (auto it = statsMap.cbegin(); it != statsMap.cend(); ++it)    {      resultText += QString("%1: %2\n").arg(it.key(), it.value().toString());    }  }
  // Display the Results  emit showStatistics(resultText);}
void StatisticalQuery::queryStatistics(bool extentOnly, bool bigCitiesOnly){  // create the parameters  StatisticsQueryParameters queryParameters;
  // Add the Statistic Definitions  QList<StatisticDefinition> definitions{    StatisticDefinition("POP", StatisticType::Average, ""),           StatisticDefinition("POP", StatisticType::Minimum, ""),    StatisticDefinition("POP", StatisticType::Maximum, ""),           StatisticDefinition("POP", StatisticType::Sum, ""),    StatisticDefinition("POP", StatisticType::StandardDeviation, ""), StatisticDefinition("POP", StatisticType::Variance, ""),    StatisticDefinition("POP", StatisticType::Count, "CityCount")};  queryParameters.setStatisticDefinitions(definitions);
  // If only using features in the current extent, set up the spatial filter for the statistics query parameters  if (extentOnly)  {    // Set the statistics query parameters geometry with the envelope    queryParameters.setGeometry(m_mapView->currentViewpoint(ViewpointType::BoundingGeometry).targetGeometry());
    // Set the spatial relationship to Intersects (which is the default)    queryParameters.setSpatialRelationship(SpatialRelationship::Intersects);  }
  // If only evaluating the largest cities (over 5 million in population), set up an attribute filter  if (bigCitiesOnly)  {    queryParameters.setWhereClause("POP_RANK = 1");  }
  // Execute the statistical query with these parameters  m_featureTable->queryStatisticsAsync(queryParameters)    .then(this, [this](StatisticsQueryResult* rawResult)  {    onQueryStatisticsCompleted_(rawResult);  });}
// [WriteFile Name=StatisticalQuery, Category=Analysis]// [Legal]// Copyright 2017 Esri.//// Licensed under the Apache License, Version 2.0 (the "License");// you may not use this file except in compliance with the License.// You may obtain a copy of the License at// http://www.apache.org/licenses/LICENSE-2.0//// Unless required by applicable law or agreed to in writing, software// distributed under the License is distributed on an "AS IS" BASIS,// WITHOUT WARRANTIES OR CONDITIONS OF ANY KIND, either express or implied.// See the License for the specific language governing permissions and// limitations under the License.// [Legal]
#ifndef STATISTICALQUERY_H#define STATISTICALQUERY_H
// Qt headers#include <QQuickItem>
namespace Esri::ArcGISRuntime{ class Map; class MapQuickView; class ServiceFeatureTable; class StatisticsQueryResult;} // namespace Esri::ArcGISRuntime
class StatisticalQuery : public QQuickItem{ Q_OBJECT
public: explicit StatisticalQuery(QQuickItem* parent = nullptr); ~StatisticalQuery() override = default;
void componentComplete() override; static void init();
Q_INVOKABLE void queryStatistics(bool extentOnly, bool bigCitiesOnly);
signals: void showStatistics(const QString& results);
private: void onQueryStatisticsCompleted_(Esri::ArcGISRuntime::StatisticsQueryResult* rawResult); Esri::ArcGISRuntime::Map* m_map = nullptr; Esri::ArcGISRuntime::MapQuickView* m_mapView = nullptr; Esri::ArcGISRuntime::ServiceFeatureTable* m_featureTable = nullptr;};
#endif // STATISTICALQUERY_H// [WriteFile Name=StatisticalQuery, Category=Analysis]// [Legal]// Copyright 2017 Esri.//// Licensed under the Apache License, Version 2.0 (the "License");// you may not use this file except in compliance with the License.// You may obtain a copy of the License at// http://www.apache.org/licenses/LICENSE-2.0//// Unless required by applicable law or agreed to in writing, software// distributed under the License is distributed on an "AS IS" BASIS,// WITHOUT WARRANTIES OR CONDITIONS OF ANY KIND, either express or implied.// See the License for the specific language governing permissions and// limitations under the License.// [Legal]
import QtQuickimport QtQuick.Controlsimport QtQuick.Layoutsimport Esri.Samples
StatisticalQuerySample { id: rootRectangle clip: true width: 800 height: 600
property alias extentOnly: extentCheckbox.checked property alias bigCitiesOnly: bigCitiesCheckbox.checked property string resultsText: ""
// add a mapView component MapView { anchors.fill: parent objectName: "mapView"
Component.onCompleted: { // Set the focus on MapView to initially enable keyboard navigation forceActiveFocus(); } }
Rectangle { anchors { fill: controlColumn margins: -10 } color: palette.base radius: 5 border { color: "darkgrey" width: 1 } }
Column { id: controlColumn anchors { left: parent.left top: parent.top margins: 15 } spacing: 8
CheckBox { id: extentCheckbox text: qsTr("Only cities in current extent") }
CheckBox { id: bigCitiesCheckbox text: qsTr("Only cities greater than 5M") }
Button { anchors.horizontalCenter: parent.horizontalCenter text: qsTr("Get Statistics") onClicked: queryStatistics(extentOnly, bigCitiesOnly) } }
Dialog { id: msgDialog modal: true x: Math.round(parent.width - width) / 2 y: Math.round(parent.height - height) / 2 standardButtons: Dialog.Ok property alias text : textLabel.text property alias informativeText : detailsLabel.text ColumnLayout { Label { id: textLabel text: qsTr("Query Statistics Results:") } Label { id: detailsLabel } } }
onShowStatistics: results => { msgDialog.informativeText = results; msgDialog.open(); }}