Create a buffer around a map point and display the results as a Graphic.
Use case
Creating buffers is a core concept in GIS proximity analysis that allows you to visualize and locate geographic features contained within a polygon. For example, suppose you wanted to visualize areas of your city where alcohol sales are prohibited because they are within 500 meters of a school. The first step in this proximity analysis would be to generate 500 meter buffer polygons around all schools in the city. Any such businesses you find inside one of the resulting polygons are violating the law.
How to use the sample
- Tap on the map.
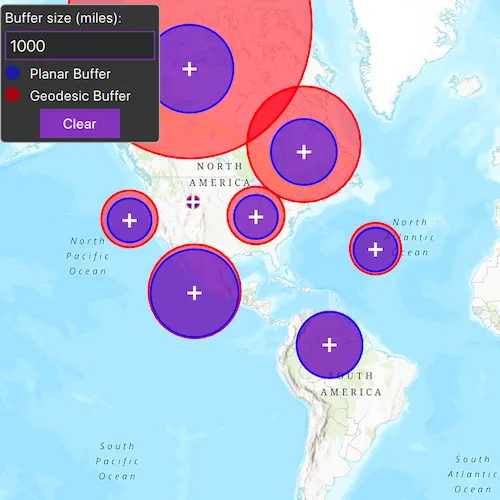
- A planar and a geodesic buffer will be created at the tap location using the distance (miles) specified in the text box.
- Continue tapping to create additional buffers. Notice that buffers closer to the equator appear similar in size. As you move north or south from the equator, however, the geodesic polygons become much larger. Geodesic polygons are in fact a better representation of the true shape and size of the buffer. Geodesic buffers will not be generated for points placed beyond +/-90 degrees latitude.
- Click
Clearto remove all buffers and start again.
How it works
- The map
Pointfor a tap on the display is captured. - The static method
GeometryEngine::bufferis called to create a planar buffer polygon from the map location and distance. - Another static method,
GeometryEngine::bufferGeodeticis called to create a geodesic buffer polygon using the same inputs. - The polygon results (and tap location) are displayed in the map view with different symbols in order to highlight the difference between the buffer techniques due to the spatial reference used in the planar calculation.
Relevant API
- GeometryEngine::buffer
- GeometryEngine::bufferGeodetic
- GraphicsOverlay
Additional information
Buffers can be generated as either planar (flat - coordinate space of the map’s spatial reference) or geodesic (technique that considers the curved shape of the Earth’s surface, which is generally a more accurate representation). In general, distortion in the map increases as you move away from the standard parallels of the spatial reference’s projection. This map is in Web Mercator so areas near the equator are the most accurate. As you move the buffer location north or south from that line, you’ll see a greater difference in the polygon size and shape. Planar operations are generally faster, but performance improvement may only be noticeable for large operations (buffering a great number or complex geometry).
Geodesic buffers in the far northern and southern regions of the map will extend beyond the map’s limits. The visible extent of the basemap in this sample is limited to between approximately +/-85 degrees latitude while geodesic buffers are calculated to extend all the way to the poles (+/-90 degrees). Also, since map view wraparound is active, geodesic buffers that cross the international date line (180 degrees longitude) will be normalized, resulting in a multipart geometry. This results in a vertical line in the buffer graphic at the dateline.
For more information about using buffer analysis, see the topic How Buffer (Analysis) works in the ArcGIS Pro documentation.
Tags
analysis, buffer, euclidean, geodesic, geometry, planar
Sample code
// [WriteFile Name=Buffer, Category=Geometry]// [Legal]// Copyright 2022 Esri.//// Licensed under the Apache License, Version 2.0 (the "License");// you may not use this file except in compliance with the License.// You may obtain a copy of the License at// http://www.apache.org/licenses/LICENSE-2.0//// Unless required by applicable law or agreed to in writing, software// distributed under the License is distributed on an "AS IS" BASIS,// WITHOUT WARRANTIES OR CONDITIONS OF ANY KIND, either express or implied.// See the License for the specific language governing permissions and// limitations under the License.// [Legal]
#ifdef PCH_BUILD#include "pch.hpp"#endif // PCH_BUILD
// sample headers#include "Buffer.h"
// ArcGIS Maps SDK headers#include "GeometryEngine.h"#include "Graphic.h"#include "GraphicListModel.h"#include "GraphicsOverlay.h"#include "GraphicsOverlayListModel.h"#include "LinearUnit.h"#include "Map.h"#include "MapQuickView.h"#include "MapTypes.h"#include "Point.h"#include "Polygon.h"#include "SimpleFillSymbol.h"#include "SimpleLineSymbol.h"#include "SimpleMarkerSymbol.h"#include "SimpleRenderer.h"#include "SymbolTypes.h"
// STL headers#include <cmath>
using namespace Esri::ArcGISRuntime;
Buffer::Buffer(QObject* parent /* = nullptr */) :  QObject(parent),  m_map(new Map(BasemapStyle::ArcGISTopographic, this)){}
Buffer::~Buffer() = default;
void Buffer::init(){  // Register the map view for QML  qmlRegisterType<MapQuickView>("Esri.Samples", 1, 0, "MapView");  qmlRegisterType<Buffer>("Esri.Samples", 1, 0, "BufferSample");}
MapQuickView* Buffer::mapView() const{  return m_mapView;}
// Set the view (created in QML)void Buffer::setMapView(MapQuickView* mapView){  if (!mapView || mapView == m_mapView)  {    return;  }
  m_mapView = mapView;  m_mapView->setMap(m_map);
  // add a graphics overlay for the geodesic buffer  m_graphicsOverlayGeodesic = new GraphicsOverlay(this);  m_mapView->graphicsOverlays()->append(m_graphicsOverlayGeodesic);
  // add a graphics overlay for the planar buffer  m_graphicsOverlayPlanar = new GraphicsOverlay(this);  m_mapView->graphicsOverlays()->append(m_graphicsOverlayPlanar);
  // add a graphics overlay for the mouse click  m_graphicsOverlayPoints = new GraphicsOverlay(this);  m_mapView->graphicsOverlays()->append(m_graphicsOverlayPoints);
  // create symbol for the geodesic buffer result  SimpleLineSymbol* outlineGeodesic = new SimpleLineSymbol(SimpleLineSymbolStyle::Solid, QColor("red"), 2.0f /*width*/, this);  SimpleFillSymbol* sfsGeodesic = new SimpleFillSymbol(SimpleFillSymbolStyle::Solid, QColor(255, 0, 0, 122), outlineGeodesic, this);  m_graphicsOverlayGeodesic->setRenderer(new SimpleRenderer(sfsGeodesic, this));
  // create symbol for the planar buffer result  SimpleLineSymbol* outlinePlanar = new SimpleLineSymbol(SimpleLineSymbolStyle::Solid, QColor("blue"), 2.0f /*width*/, this);  SimpleFillSymbol* sfsPlanar = new SimpleFillSymbol(SimpleFillSymbolStyle::Solid, QColor(0, 0, 255, 122), outlinePlanar, this);  m_graphicsOverlayPlanar->setRenderer(new SimpleRenderer(sfsPlanar, this));
  // create symbol for the mouse click  SimpleMarkerSymbol* sms = new SimpleMarkerSymbol(SimpleMarkerSymbolStyle::Cross, QColor("white"), 14.0f /*width*/, this);  m_graphicsOverlayPoints->setRenderer(new SimpleRenderer(sms, this));
  // connect to mouse clicked signal  connect(m_mapView, &MapQuickView::mouseClicked, this, &Buffer::onMouseClicked);
  emit mapViewChanged();}
// handle the mouse click - perform a buffer on clickvoid Buffer::onMouseClicked(QMouseEvent& mouse){  // get the map point from the mouse click  const Point point = m_mapView->screenToLocation(mouse.position().x(), mouse.position().y());
  // Create a variable to be the buffer size in meters. There are 1609.34 meters in one mile.  const int bufferInMeters = bufferSize() * 1609.34;
  // Create a planar buffer graphic around the input location at the specified distance.  const Geometry buffer = GeometryEngine::buffer(point, bufferInMeters);
  // Add the result planar buffer as a graphic  Graphic* resultGraphicPlanar = new Graphic(buffer, this);  m_graphicsOverlayPlanar->graphics()->append(resultGraphicPlanar);
  // Create a geodesic buffer graphic around the input location at the specified distance.  const Geometry bufferGeodesic =    GeometryEngine::bufferGeodetic(point, bufferInMeters, LinearUnit(LinearUnitId::Meters), NAN, GeodeticCurveType::Geodesic);
  // Add the result geodesic buffer as a graphic  Graphic* resultGraphicGeodesic = new Graphic(bufferGeodesic, this);  m_graphicsOverlayGeodesic->graphics()->append(resultGraphicGeodesic);
  // Add the clicked point as a graphic  Graphic* clickedPointGraphic = new Graphic(point, this);  m_graphicsOverlayPoints->graphics()->append(clickedPointGraphic);}
int Buffer::bufferSize() const{  return m_bufferSize;}
void Buffer::setBufferSize(int size){  if (size == m_bufferSize)  {    return;  }
  m_bufferSize = size;}
void Buffer::clear(){  m_graphicsOverlayGeodesic->graphics()->clear();  m_graphicsOverlayPlanar->graphics()->clear();  m_graphicsOverlayPoints->graphics()->clear();}
// [WriteFile Name=Buffer, Category=Geometry]// [Legal]// Copyright 2022 Esri.//// Licensed under the Apache License, Version 2.0 (the "License");// you may not use this file except in compliance with the License.// You may obtain a copy of the License at// http://www.apache.org/licenses/LICENSE-2.0//// Unless required by applicable law or agreed to in writing, software// distributed under the License is distributed on an "AS IS" BASIS,// WITHOUT WARRANTIES OR CONDITIONS OF ANY KIND, either express or implied.// See the License for the specific language governing permissions and// limitations under the License.// [Legal]
#ifndef BUFFER_H#define BUFFER_H
// Qt headers#include <QMouseEvent>#include <QObject>
namespace Esri::ArcGISRuntime{ class GraphicsOverlay; class Map; class MapQuickView; class SimpleMarkerSymbol; class SimpleFillSymbol;} // namespace Esri::ArcGISRuntime
Q_MOC_INCLUDE("MapQuickView.h");
class Buffer : public QObject{ Q_OBJECT
Q_PROPERTY(Esri::ArcGISRuntime::MapQuickView* mapView READ mapView WRITE setMapView NOTIFY mapViewChanged) Q_PROPERTY(int bufferSize READ bufferSize WRITE setBufferSize NOTIFY bufferSizeChanged)
public: explicit Buffer(QObject* parent = nullptr); ~Buffer() override;
static void init();
Q_INVOKABLE void clear();
signals: void mapViewChanged(); void bufferSizeChanged();
private: Esri::ArcGISRuntime::MapQuickView* mapView() const; void setMapView(Esri::ArcGISRuntime::MapQuickView* mapView); int bufferSize() const; void setBufferSize(int size); void onMouseClicked(QMouseEvent& mouse);
Esri::ArcGISRuntime::Map* m_map = nullptr; Esri::ArcGISRuntime::MapQuickView* m_mapView = nullptr; Esri::ArcGISRuntime::GraphicsOverlay* m_graphicsOverlayPlanar = nullptr; Esri::ArcGISRuntime::GraphicsOverlay* m_graphicsOverlayGeodesic = nullptr; Esri::ArcGISRuntime::GraphicsOverlay* m_graphicsOverlayPoints = nullptr; int m_bufferSize = 1000;};
#endif // BUFFER_H// [WriteFile Name=Buffer, Category=Geometry]// [Legal]// Copyright 2022 Esri.//// Licensed under the Apache License, Version 2.0 (the "License");// you may not use this file except in compliance with the License.// You may obtain a copy of the License at// http://www.apache.org/licenses/LICENSE-2.0//// Unless required by applicable law or agreed to in writing, software// distributed under the License is distributed on an "AS IS" BASIS,// WITHOUT WARRANTIES OR CONDITIONS OF ANY KIND, either express or implied.// See the License for the specific language governing permissions and// limitations under the License.// [Legal]
import QtQuickimport QtQuick.Controlsimport Esri.Samples
Item {
// add a mapView component MapView { id: view anchors.fill: parent
Component.onCompleted: { // Set and keep the focus on MapView to enable keyboard navigation forceActiveFocus(); } }
// Declare the C++ instance which creates the map etc. and supply the view BufferSample { id: model mapView: view }
// display a control pane to change size Rectangle { anchors { margins: -5 fill: controlColumn } color: palette.base radius: 5 border { color: "darkgray" width: 1 } }
Column { id: controlColumn anchors { left: parent.left top: parent.top margins: 10 } spacing: 5
Label { text: qsTr("Buffer size (miles):") }
TextField { id: bufferSizeText validator: IntValidator { bottom: 1; top: 10000 } text: qsTr("1000") selectByMouse: true onTextChanged: model.bufferSize = Number(text); }
Row { spacing: 10
Rectangle { radius: 100 width: 15 height: width color: "blue" opacity: 0.5 }
Label { text: qsTr("Planar Buffer") } }
Row { spacing: 10
Rectangle { radius: 100 width: 15 height: width color: "red" opacity: 0.5 }
Label { text: qsTr("Geodesic Buffer") } }
Button { anchors.horizontalCenter: parent.horizontalCenter text: qsTr("Clear") onClicked: { model.clear(); } } }}