Perform an interactive viewshed analysis to determine visible and non-visible areas from a given observer position.
How to use the sample
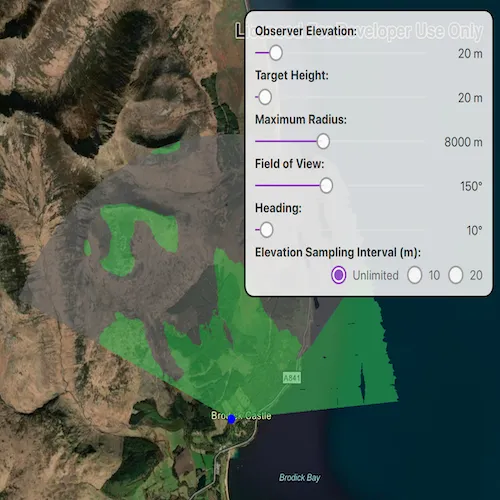
The sample loads with a viewshed analysis initialized from an elevation raster covering the Isle of Arran, Scotland. Transparent green shows the area visible from the observer position, and grey shows the non-visible areas. Move the observer position by clicking and dragging over the island to interactively evaluate the viewshed result and display it in the analysis overlay. Alternatively, click on the map to see the viewshed from the clicked location. Use the control panel to explore how the viewshed analysis results change when adjusting the observer elevation, target height, maximum radius, field of view, heading and elevation sampling interval. As you move the observer and update the viewshed parameters, the analysis overlay refreshes to show the evaluated viewshed result.
How it works
- Create an
Mapand set it on anMapView. - Add a
GraphicsOverlayto draw the observer point and anAnalysisOverlayto the map view. - Create a
ContinuousFieldfrom a raster file containing elevation data. - Create and configure
ViewshedParameters, passing in anPointas the observer position for the viewshed. - Create a
ContinuousFieldFunctionfrom the continuous field. - Create a
ViewshedFunctionusing the continuous field function and viewshed parameters, then convert it to aDiscreteFieldFunction. - Create a
ColormapRendererfrom aColormapwith colors that represent visible and non-visible results. - Create a
FieldAnalysisfrom the discrete field function and colormap renderer, then add it to theAnalysisOverlay’s collection of analysis objects to display the results. As parameter values change, the result is recalculated and redrawn automatically.
Relevant API
- AnalysisOverlay
- Colormap
- ColormapRenderer
- ContinuousField
- ContinuousFieldFunction
- FieldAnalysis
- ViewshedFunction
- ViewshedParameters
Offline data
The sample uses a 10m resolution digital terrain elevation raster of the Isle of Arran, Scotland (Data Copyright Scottish Government and SEPA (2014)).
Tags
analysis overlay, elevation, field analysis, interactive, raster, spatial analysis, terrain, viewshed, visibility
Sample code
// [WriteFile Name=ShowInteractiveViewshedWithAnalysisOverlay, Category=Analysis]// [Legal]// Copyright 2026 Esri.//// Licensed under the Apache License, Version 2.0 (the "License");// you may not use this file except in compliance with the License.// You may obtain a copy of the License at// http://www.apache.org/licenses/LICENSE-2.0//// Unless required by applicable law or agreed to in writing, software// distributed under the License is distributed on an "AS IS" BASIS,// WITHOUT WARRANTIES OR CONDITIONS OF ANY KIND, either express or implied.// See the License for the specific language governing permissions and// limitations under the License.// [Legal]
#ifdef PCH_BUILD#include "pch.hpp"#endif // PCH_BUILD
#include "ShowInteractiveViewshedWithAnalysisOverlay.h"
#include "AnalysisOverlay.h"#include "AnalysisListModel.h"#include "AnalysisOverlayListModel.h"#include "Colormap.h"#include "ColormapRenderer.h"#include "ContinuousField.h"#include "ContinuousFieldFunction.h"#include "FieldAnalysis.h"#include "Graphic.h"#include "GraphicListModel.h"#include "GraphicsOverlay.h"#include "GraphicsOverlayListModel.h"#include "Map.h"#include "MapQuickView.h"#include "MapTypes.h"#include "Point.h"#include "SimpleMarkerSymbol.h"#include "SpatialReference.h"#include "SymbolTypes.h"#include "Viewpoint.h"#include "ViewshedFunction.h"#include "ViewshedParameters.h"
#include <QStandardPaths>#include <QFuture>
using namespace Esri::ArcGISRuntime;
namespace{  QString defaultDataPath()  {#ifdef Q_OS_IOS    return QStandardPaths::writableLocation(QStandardPaths::DocumentsLocation);#else    return QStandardPaths::writableLocation(QStandardPaths::HomeLocation);#endif  }} // namespace
ShowInteractiveViewshedWithAnalysisOverlay::ShowInteractiveViewshedWithAnalysisOverlay(QObject* parent /* = nullptr */) :  QObject(parent),  // Create a map with the imagery style.  m_map(new Map(BasemapStyle::ArcGISImagery, this)),  // The elevation file used in the analysis.  m_elevationFilePath(defaultDataPath() + "/ArcGIS/Runtime/Data/raster/arran.tif"){}
ShowInteractiveViewshedWithAnalysisOverlay::~ShowInteractiveViewshedWithAnalysisOverlay() = default;
void ShowInteractiveViewshedWithAnalysisOverlay::init(){  // Register the map view for QML  qmlRegisterType<MapQuickView>("Esri.Samples", 1, 0, "MapView");  qmlRegisterType<ShowInteractiveViewshedWithAnalysisOverlay>("Esri.Samples", 1, 0, "ShowInteractiveViewshedWithAnalysisOverlaySample");}
MapQuickView* ShowInteractiveViewshedWithAnalysisOverlay::mapView() const{  return m_mapView;}
// Set the view (created in QML)void ShowInteractiveViewshedWithAnalysisOverlay::setMapView(MapQuickView* mapView){  if (!mapView || mapView == m_mapView)  {    return;  }
  setInitialViewpoint();
  m_mapView = mapView;  m_mapView->setMap(m_map);
  emit mapViewChanged();
  addOverlays();  connectSignals();}
void ShowInteractiveViewshedWithAnalysisOverlay::setInitialViewpoint(){  // Set an initial viewpoint centered over the observer position.  const double latitude  = 55.610000;  const double longitude = -5.200346;  const double scale = 100000;  const Viewpoint initialViewpoint(latitude, longitude, scale);
  m_map->setInitialViewpoint(initialViewpoint);}
void ShowInteractiveViewshedWithAnalysisOverlay::connectSignals(){  // Tap to reposition observer.  connect(m_mapView, &MapQuickView::mouseClicked, this, [this](QMouseEvent& event)  {    if (!m_initialized)    {      return;    }
    updateObserverPositionFromScreen(event.position().x(), event.position().y());  });
  // Long-press starts observer drag.  connect(m_mapView, &MapQuickView::mousePressedAndHeld, this, [this](QMouseEvent& event)  {    if (!m_initialized)    {      return;    }
    startObserverDrag(event.position().x(), event.position().y());  });
  // Update observer while dragging.  connect(m_mapView, &MapQuickView::mouseMoved, this, [this](QMouseEvent& event)  {    if (!m_initialized || !m_isDraggingObserver)    {      return;    }
    dragObserver(event.position().x(), event.position().y());  });
  // End observer drag.  connect(m_mapView, &MapQuickView::mouseReleased, this, [this](QMouseEvent& event)  {    if (!m_initialized || !m_isDraggingObserver)    {      return;    }
    endObserverDrag(event.position().x(), event.position().y());  });}
void ShowInteractiveViewshedWithAnalysisOverlay::addOverlays(){  // Create and add a graphics overlay to the map view.  m_graphicsOverlay = new GraphicsOverlay(this);  m_mapView->graphicsOverlays()->append(m_graphicsOverlay);
  // Create and add an analysis overlay to the map view.  m_analysisOverlay = new AnalysisOverlay(this);  m_mapView->analysisOverlays()->append(m_analysisOverlay);
  createContinuousField();}
void ShowInteractiveViewshedWithAnalysisOverlay::createContinuousField(){  // Create the continuous field from the elevation file.  const QStringList elevationFilePaths{m_elevationFilePath};  ContinuousField::createFromFilesAsync(elevationFilePaths, 0, this)    .then(this,          [this](ContinuousField* continuousField)  {    if (!continuousField)    {      return;    }
    m_continuousField = continuousField;
    initializeViewshed();  });}
void ShowInteractiveViewshedWithAnalysisOverlay::initializeViewshed(){  // Set the initial observer position  m_observerPositionPoint = Point(-579246.504, // x                                  7479619.947, // y                                  m_observerPointZ, // z                                  SpatialReference::webMercator()); // spatialReference
  // Synchronize the viewshed parameters and graphic to the initial observer position.  syncObserverGraphic();
  // Initialize the viewshed parameters.  m_viewshedParameters = new ViewshedParameters(this);  m_viewshedParameters->setObserverPosition(m_observerPositionPoint);  m_viewshedParameters->setTargetHeight(m_targetHeight);  m_viewshedParameters->setMaxRadius(m_maxRadius);  m_viewshedParameters->setFieldOfView(m_fieldOfView);  m_viewshedParameters->setHeading(m_headingValue);  m_viewshedParameters->setElevationSamplingInterval(m_elevationSamplingInterval);
  m_viewshedFunction = ViewshedFunction::create(m_continuousField, m_viewshedParameters, this);
  // Convert the viewshed function to a discrete field function.  m_discreteViewshed = m_viewshedFunction->toDiscreteFieldFunction();
  // Create colormap renderer for displaying viewshed result.  const QList<QColor> colors{QColor(100, 100, 100, 160),QColor(90, 170, 90, 160)};  Colormap* colormap = Colormap::create(colors, this);  ColormapRenderer* colormapRenderer = new ColormapRenderer(colormap, this);
  FieldAnalysis* analysis = FieldAnalysis::create(m_discreteViewshed, colormapRenderer, this);  m_analysisOverlay->analyses()->append(analysis);
  m_initialized = true;  emit initializedChanged();  emit observerElevationChanged();  emit targetHeightChanged();  emit maxRadiusChanged();  emit fieldOfViewChanged();  emit headingChanged();  emit elevationSamplingIntervalChanged();}
void ShowInteractiveViewshedWithAnalysisOverlay::syncObserverGraphic(){  // Update the observer graphic geometry to the current observer position.  if (!m_observerGraphic)  {    m_observerSymbol = new SimpleMarkerSymbol(SimpleMarkerSymbolStyle::Circle, QColor(Qt::blue), 10.0f /*size*/, this);    m_observerGraphic = new Graphic(m_observerPositionPoint, m_observerSymbol, this);
    m_graphicsOverlay->graphics()->append(m_observerGraphic);    return;  }
  m_observerGraphic->setGeometry(m_observerPositionPoint);}
void ShowInteractiveViewshedWithAnalysisOverlay::updateObserverPositionFromScreen(double x, double y){  if (!m_mapView || !m_viewshedParameters)  {    return;  }
  // Find the map position corresponding to the tapped or dragged screen point.  const Point mapPoint = m_mapView->screenToLocation(x, y);  // Update the observer position while preserving the current elevation.  m_observerPositionPoint = Point(mapPoint.x(), mapPoint.y(), m_observerPointZ, SpatialReference::webMercator());  // Update the viewshed parameters.  m_viewshedParameters->setObserverPosition(m_observerPositionPoint);  syncObserverGraphic();}
void ShowInteractiveViewshedWithAnalysisOverlay::setObserverElevation(double value){  m_observerPointZ = value;  if (!m_initialized)  {    return;  }
  // Update the observer elevation and sync analysis and graphic.  m_observerPositionPoint = Point(m_observerPositionPoint.x(), m_observerPositionPoint.y(), m_observerPointZ, SpatialReference::webMercator());  m_viewshedParameters->setObserverPosition(m_observerPositionPoint);  syncObserverGraphic();  emit observerElevationChanged();}
void ShowInteractiveViewshedWithAnalysisOverlay::setTargetHeight(double value){  if (m_targetHeight == value)  {    return;  }
  m_targetHeight = value;  if (m_viewshedParameters)  {    m_viewshedParameters->setTargetHeight(value);  }
  emit targetHeightChanged();}
void ShowInteractiveViewshedWithAnalysisOverlay::setMaxRadius(double value){  if (m_maxRadius == value)  {    return;  }
  m_maxRadius = value;  if (m_viewshedParameters)  {    m_viewshedParameters->setMaxRadius(value);  }
  emit maxRadiusChanged();}
void ShowInteractiveViewshedWithAnalysisOverlay::setFieldOfView(double value){  if (m_fieldOfView == value)  {    return;  }
  m_fieldOfView = value;  if (m_viewshedParameters)  {    m_viewshedParameters->setFieldOfView(value);  }
  emit fieldOfViewChanged();}
void ShowInteractiveViewshedWithAnalysisOverlay::setHeading(double value){  if (m_headingValue == value)  {    return;  }
  m_headingValue = value;  if (m_viewshedParameters)  {    m_viewshedParameters->setHeading(value);  }
  emit headingChanged();}
void ShowInteractiveViewshedWithAnalysisOverlay::setElevationSamplingInterval(double value){  std::optional<double> newInterval = (value == 0.0) ? std::nullopt : std::optional<double>(value);
  if (m_elevationSamplingInterval == newInterval)  {    return;  }
  m_elevationSamplingInterval = newInterval;  if (m_viewshedParameters)  {    m_viewshedParameters->setElevationSamplingInterval(m_elevationSamplingInterval);  }
  emit elevationSamplingIntervalChanged();}
double ShowInteractiveViewshedWithAnalysisOverlay::elevationSamplingInterval() const{  return m_elevationSamplingInterval.value_or(0.0);}
bool ShowInteractiveViewshedWithAnalysisOverlay::initialized() const{  return m_initialized;}
void ShowInteractiveViewshedWithAnalysisOverlay::startObserverDrag(double x, double y){  if (!m_initialized)  {    return;  }
  if (m_observerSymbol)  {    // Change the observer graphic color to indicate it is being moved.    m_observerSymbol->setColor(QColor(Qt::yellow));  }
  m_isDraggingObserver = true;  updateObserverPositionFromScreen(x, y);}
void ShowInteractiveViewshedWithAnalysisOverlay::dragObserver(double x, double y){  if (!m_initialized || !m_isDraggingObserver) {    return;  }
  updateObserverPositionFromScreen(x, y);}
void ShowInteractiveViewshedWithAnalysisOverlay::endObserverDrag(double x, double y){  if (!m_initialized)  {    return;  }
  updateObserverPositionFromScreen(x, y);
  if (m_observerSymbol)  {    // Change the observer graphic color back when dragging ends.    m_observerSymbol->setColor(QColor(Qt::blue));  }
  m_isDraggingObserver = false;}
// [WriteFile Name=ShowInteractiveViewshedWithAnalysisOverlay, Category=Analysis]// [Legal]// Copyright 2026 Esri.//// Licensed under the Apache License, Version 2.0 (the "License");// you may not use this file except in compliance with the License.// You may obtain a copy of the License at// http://www.apache.org/licenses/LICENSE-2.0//// Unless required by applicable law or agreed to in writing, software// distributed under the License is distributed on an "AS IS" BASIS,// WITHOUT WARRANTIES OR CONDITIONS OF ANY KIND, either express or implied.// See the License for the specific language governing permissions and// limitations under the License.// [Legal]
#ifndef SHOWINTERACTIVEVIEWSHEDWITHANALYSISOVERLAY_H#define SHOWINTERACTIVEVIEWSHEDWITHANALYSISOVERLAY_H
#include <QObject>#include <optional>
// ArcGISRuntime headers#include <Point.h>
namespace Esri::ArcGISRuntime{ class AnalysisOverlay; class ContinuousField; class ContinuousFieldFunction; class DiscreteFieldFunction; class Graphic; class GraphicsOverlay; class Map; class MapQuickView; class SimpleMarkerSymbol; class ViewshedFunction; class ViewshedParameters;} // namespace Esri::ArcGISRuntime
Q_MOC_INCLUDE("MapQuickView.h");
class ShowInteractiveViewshedWithAnalysisOverlay : public QObject{ Q_OBJECT
Q_PROPERTY(Esri::ArcGISRuntime::MapQuickView* mapView READ mapView WRITE setMapView NOTIFY mapViewChanged) Q_PROPERTY(bool initialized READ initialized NOTIFY initializedChanged) Q_PROPERTY(double observerElevation MEMBER m_observerPointZ WRITE setObserverElevation NOTIFY observerElevationChanged) Q_PROPERTY(double targetHeight MEMBER m_targetHeight WRITE setTargetHeight NOTIFY targetHeightChanged) Q_PROPERTY(double maxRadius MEMBER m_maxRadius WRITE setMaxRadius NOTIFY maxRadiusChanged) Q_PROPERTY(double fieldOfView MEMBER m_fieldOfView WRITE setFieldOfView NOTIFY fieldOfViewChanged) Q_PROPERTY(double heading MEMBER m_headingValue WRITE setHeading NOTIFY headingChanged) Q_PROPERTY(double elevationSamplingInterval READ elevationSamplingInterval WRITE setElevationSamplingInterval NOTIFY elevationSamplingIntervalChanged)
public: explicit ShowInteractiveViewshedWithAnalysisOverlay(QObject* parent = nullptr); ~ShowInteractiveViewshedWithAnalysisOverlay() override;
static void init(); double elevationSamplingInterval() const; bool initialized() const; Q_INVOKABLE void dragObserver(double x, double y); Q_INVOKABLE void endObserverDrag(double x, double y); Q_INVOKABLE void startObserverDrag(double x, double y);
signals: void elevationSamplingIntervalChanged(); void fieldOfViewChanged(); void headingChanged(); void initializedChanged(); void mapViewChanged(); void maxRadiusChanged(); void observerElevationChanged(); void targetHeightChanged();
private: Esri::ArcGISRuntime::MapQuickView* mapView() const; void setMapView(Esri::ArcGISRuntime::MapQuickView* mapView); void setInitialViewpoint(); void addOverlays(); void createContinuousField(); void connectSignals(); void initializeViewshed(); void syncObserverGraphic(); void updateObserverPositionFromScreen(double x, double y); void setObserverElevation(double value); void setTargetHeight(double value); void setMaxRadius(double value); void setFieldOfView(double value); void setHeading(double value); void setElevationSamplingInterval(double value);
Esri::ArcGISRuntime::Map* m_map = nullptr; Esri::ArcGISRuntime::MapQuickView* m_mapView = nullptr; Esri::ArcGISRuntime::GraphicsOverlay* m_graphicsOverlay = nullptr; Esri::ArcGISRuntime::AnalysisOverlay* m_analysisOverlay = nullptr; Esri::ArcGISRuntime::Point m_observerPositionPoint; Esri::ArcGISRuntime::Graphic* m_observerGraphic = nullptr; Esri::ArcGISRuntime::SimpleMarkerSymbol* m_observerSymbol = nullptr; Esri::ArcGISRuntime::ViewshedParameters* m_viewshedParameters = nullptr; Esri::ArcGISRuntime::ContinuousField* m_continuousField = nullptr; Esri::ArcGISRuntime::ViewshedFunction* m_viewshedFunction = nullptr; Esri::ArcGISRuntime::DiscreteFieldFunction* m_discreteViewshed = nullptr; const QString m_elevationFilePath; bool m_initialized = false; bool m_isDraggingObserver = false; double m_targetHeight = 20.0; double m_maxRadius = 8000.0; double m_fieldOfView = 150.0; double m_headingValue = 10.0; std::optional<double> m_elevationSamplingInterval; double m_observerPointZ = 20.0;};
#endif // SHOWINTERACTIVEVIEWSHEDWITHANALYSISOVERLAY_H// [WriteFile Name=ShowInteractiveViewshedWithAnalysisOverlay, Category=Analysis]// [Legal]// Copyright 2026 Esri.
// Licensed under the Apache License, Version 2.0 (the "License");// you may not use this file except in compliance with the License.// You may obtain a copy of the License at// http://www.apache.org/licenses/LICENSE-2.0
// Unless required by applicable law or agreed to in writing, software// distributed under the License is distributed on an "AS IS" BASIS,// WITHOUT WARRANTIES OR CONDITIONS OF ANY KIND, either express or implied.// See the License for the specific language governing permissions and// limitations under the License.// [Legal]
import QtQuickimport QtQuick.Controlsimport QtQuick.Layoutsimport Esri.Samples
Item { readonly property bool compactUi: width < 760
// Declare the C++ instance which creates the map and analysis setup. ShowInteractiveViewshedWithAnalysisOverlaySample { id: model }
// add a mapView component MapView { id: view anchors.fill: parent focus: true }
Component.onCompleted: { model.mapView = view }
// Settings panel with controls for viewshed parameters. Rectangle { id: settingsPanel anchors.top: parent.top anchors.right: parent.right anchors.topMargin: compactUi ? 26 : 32 anchors.rightMargin: compactUi ? 10 : 16 radius: 12 color: palette.base border.color: "black" border.width: 2 opacity: 0.85 readonly property int panelPadding: compactUi ? 10 : 14 width: Math.min(settingsColumn.implicitWidth + panelPadding * 2, parent.width - anchors.rightMargin * 2) height: settingsColumn.implicitHeight + panelPadding * 2
MouseArea { anchors.fill: parent acceptedButtons: Qt.LeftButton | Qt.RightButton onClicked: mouse => mouse.accepted = true onDoubleClicked: mouse => mouse.accepted = true onWheel: wheel => wheel.accepted = true }
ColumnLayout { id: settingsColumn anchors.fill: parent anchors.margins: settingsPanel.panelPadding spacing: compactUi ? 4 : 6
ColumnLayout { spacing: compactUi ? 2 : 6 Label { text: qsTr("Observer Elevation:") font.bold: true Layout.preferredWidth: 180 }
RowLayout { spacing: compactUi ? 4 : 10
Slider { Layout.fillWidth: true Layout.preferredWidth: compactUi ? 120 : 220 from: 2 to: 200 stepSize: 1 enabled: model.initialized value: model.observerElevation onValueChanged: model.observerElevation = value } Label { Layout.preferredWidth: compactUi ? 52 : 64 horizontalAlignment: Text.AlignRight text: qsTr("%1 m").arg(Math.round(model.observerElevation)) } } }
ColumnLayout { visible: model.initialized spacing: compactUi ? 2 : 6 Label { text: qsTr("Target Height:") font.bold: true Layout.preferredWidth: 180 }
RowLayout { spacing: compactUi ? 4 : 10
Slider { Layout.fillWidth: true Layout.preferredWidth: compactUi ? 120 : 220 from: 2 to: 1000 stepSize: 1 value: model.targetHeight onValueChanged: model.targetHeight = value } Label { Layout.preferredWidth: compactUi ? 52 : 64 horizontalAlignment: Text.AlignRight text: qsTr("%1 m").arg(Math.round(model.targetHeight)) } } }
ColumnLayout { visible: model.initialized spacing: compactUi ? 2 : 6 Label { text: qsTr("Maximum Radius:") font.bold: true Layout.preferredWidth: 180 }
RowLayout { spacing: compactUi ? 4 : 10
Slider { Layout.fillWidth: true Layout.preferredWidth: compactUi ? 120 : 220 from: 250 to: 20000 stepSize: 10 value: model.maxRadius onValueChanged: model.maxRadius = value } Label { Layout.preferredWidth: compactUi ? 52 : 64 horizontalAlignment: Text.AlignRight text: qsTr("%1 m").arg(Math.round(model.maxRadius)) } } }
ColumnLayout { visible: model.initialized spacing: compactUi ? 2 : 6 Label { text: qsTr("Field of View:") font.bold: true Layout.preferredWidth: 180 }
RowLayout { spacing: compactUi ? 4 : 10
Slider { Layout.fillWidth: true Layout.preferredWidth: compactUi ? 120 : 220 from: 5 to: 360 stepSize: 1 value: model.fieldOfView onValueChanged: model.fieldOfView = value } Label { Layout.preferredWidth: compactUi ? 52 : 64 horizontalAlignment: Text.AlignRight text: qsTr("%1\u00B0").arg(Math.round(model.fieldOfView)) } } }
ColumnLayout { visible: model.initialized spacing: compactUi ? 2 : 6 Label { text: qsTr("Heading:") font.bold: true Layout.preferredWidth: 180 }
RowLayout { spacing: compactUi ? 4 : 10
Slider { Layout.fillWidth: true Layout.preferredWidth: compactUi ? 120 : 220 from: 0 to: 360 stepSize: 1 value: model.heading onValueChanged: model.heading = value } Label { Layout.preferredWidth: compactUi ? 52 : 64 horizontalAlignment: Text.AlignRight text: qsTr("%1\u00B0").arg(Math.round(model.heading)) } } }
ColumnLayout { visible: model.initialized spacing: compactUi ? 2 : 6 Label { text: qsTr("Elevation Sampling Interval (m):") font.bold: true Layout.preferredWidth: implicitWidth + 8 }
ButtonGroup { id: samplingGroup }
RowLayout { Layout.fillWidth: true Layout.alignment: Qt.AlignRight spacing: compactUi ? 4 : 8
Item { Layout.fillWidth: true }
RadioButton { checked: model.elevationSamplingInterval === 0 ButtonGroup.group: samplingGroup text: qsTr("Unlimited") onClicked: model.elevationSamplingInterval = 0 }
RadioButton { checked: model.elevationSamplingInterval === 10 ButtonGroup.group: samplingGroup text: qsTr("10") onClicked: model.elevationSamplingInterval = 10 }
RadioButton { checked: model.elevationSamplingInterval === 20 ButtonGroup.group: samplingGroup text: qsTr("20") onClicked: model.elevationSamplingInterval = 20 } } } } }
Label { anchors.left: parent.left anchors.top: parent.top anchors.leftMargin: 8 anchors.topMargin: 8 text: qsTr("Raster data Copyright Scottish Government and SEPA (2014)") font.italic: true font.pointSize: 12 color: "white" font.bold: true }}