Use the portal to pre-style your feature layer using data-driven visualization.
Prerequisites
- You need an ArcGIS Location Platform or ArcGIS Online account.
- You need to complete Step 1. Import GeoJSON.
Steps
Go to the item page
Navigate to the item page of the hosted feature layer to access the styling tools.
-
In the top navigation bar, click Content.
-
Click the feature layer item created in the previous step to view its item page.
-
Click Visualization in the top menu bar.
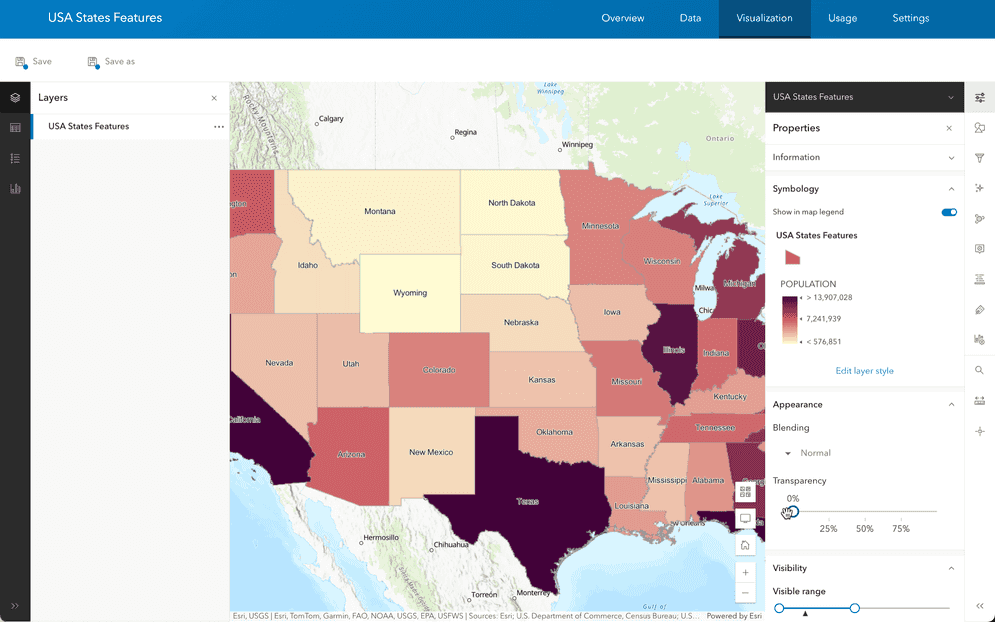
Style features
Style the features using the population attribute to create a color ramp that highlights population differences across states.
-
In the left panel, click Layers and select the USA States Population layer.
-
In the right panel, click Styles.
-
Click + Field and add
POPULATION. -
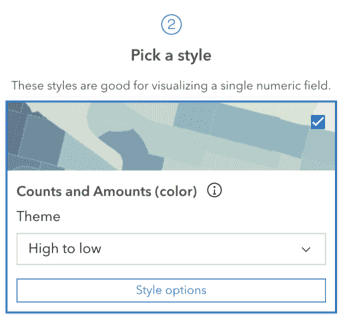
Under Pick a style, select Counts and Amounts (color).
-
In the Theme dropdown menu, select High to low.
-
Click Style options.
-
Click the pencil icon under Symbol style to modify the symbol style.
-
Click the pencil icon under Colors to modify the color.
-
In the Ramp menu, select a color ramp of your choice > Done.

-
Click the X to exit out of Symbol style. Then, click Done twice.
-
Click Save to save the style in the feature layer item.
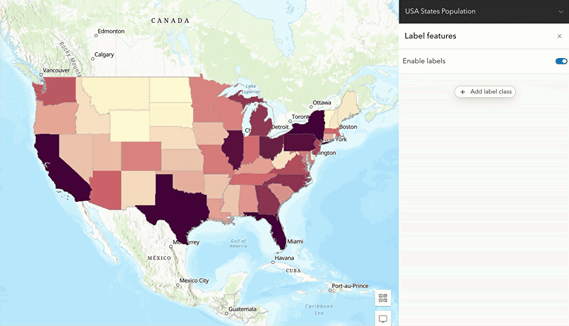
Style text
Add labels to the layer so state names are visible on the map.
-
In the right panel, click Labels.
-
Click + Add label class.
-
In the Label field dropdown menu, select STATE_NAME.
-
Click Save to save the style in the feature layer item.