Learn how to find elevation values for points along a path in New Zealand's South Island.
The ArcGIS Elevation service is a location service that returns elevation values for a single location or multiple locations. Elevation coverage is provided for both topography (land elevations) and bathymetry (water depths) and takes location inputs as longitude and latitude coordinates.
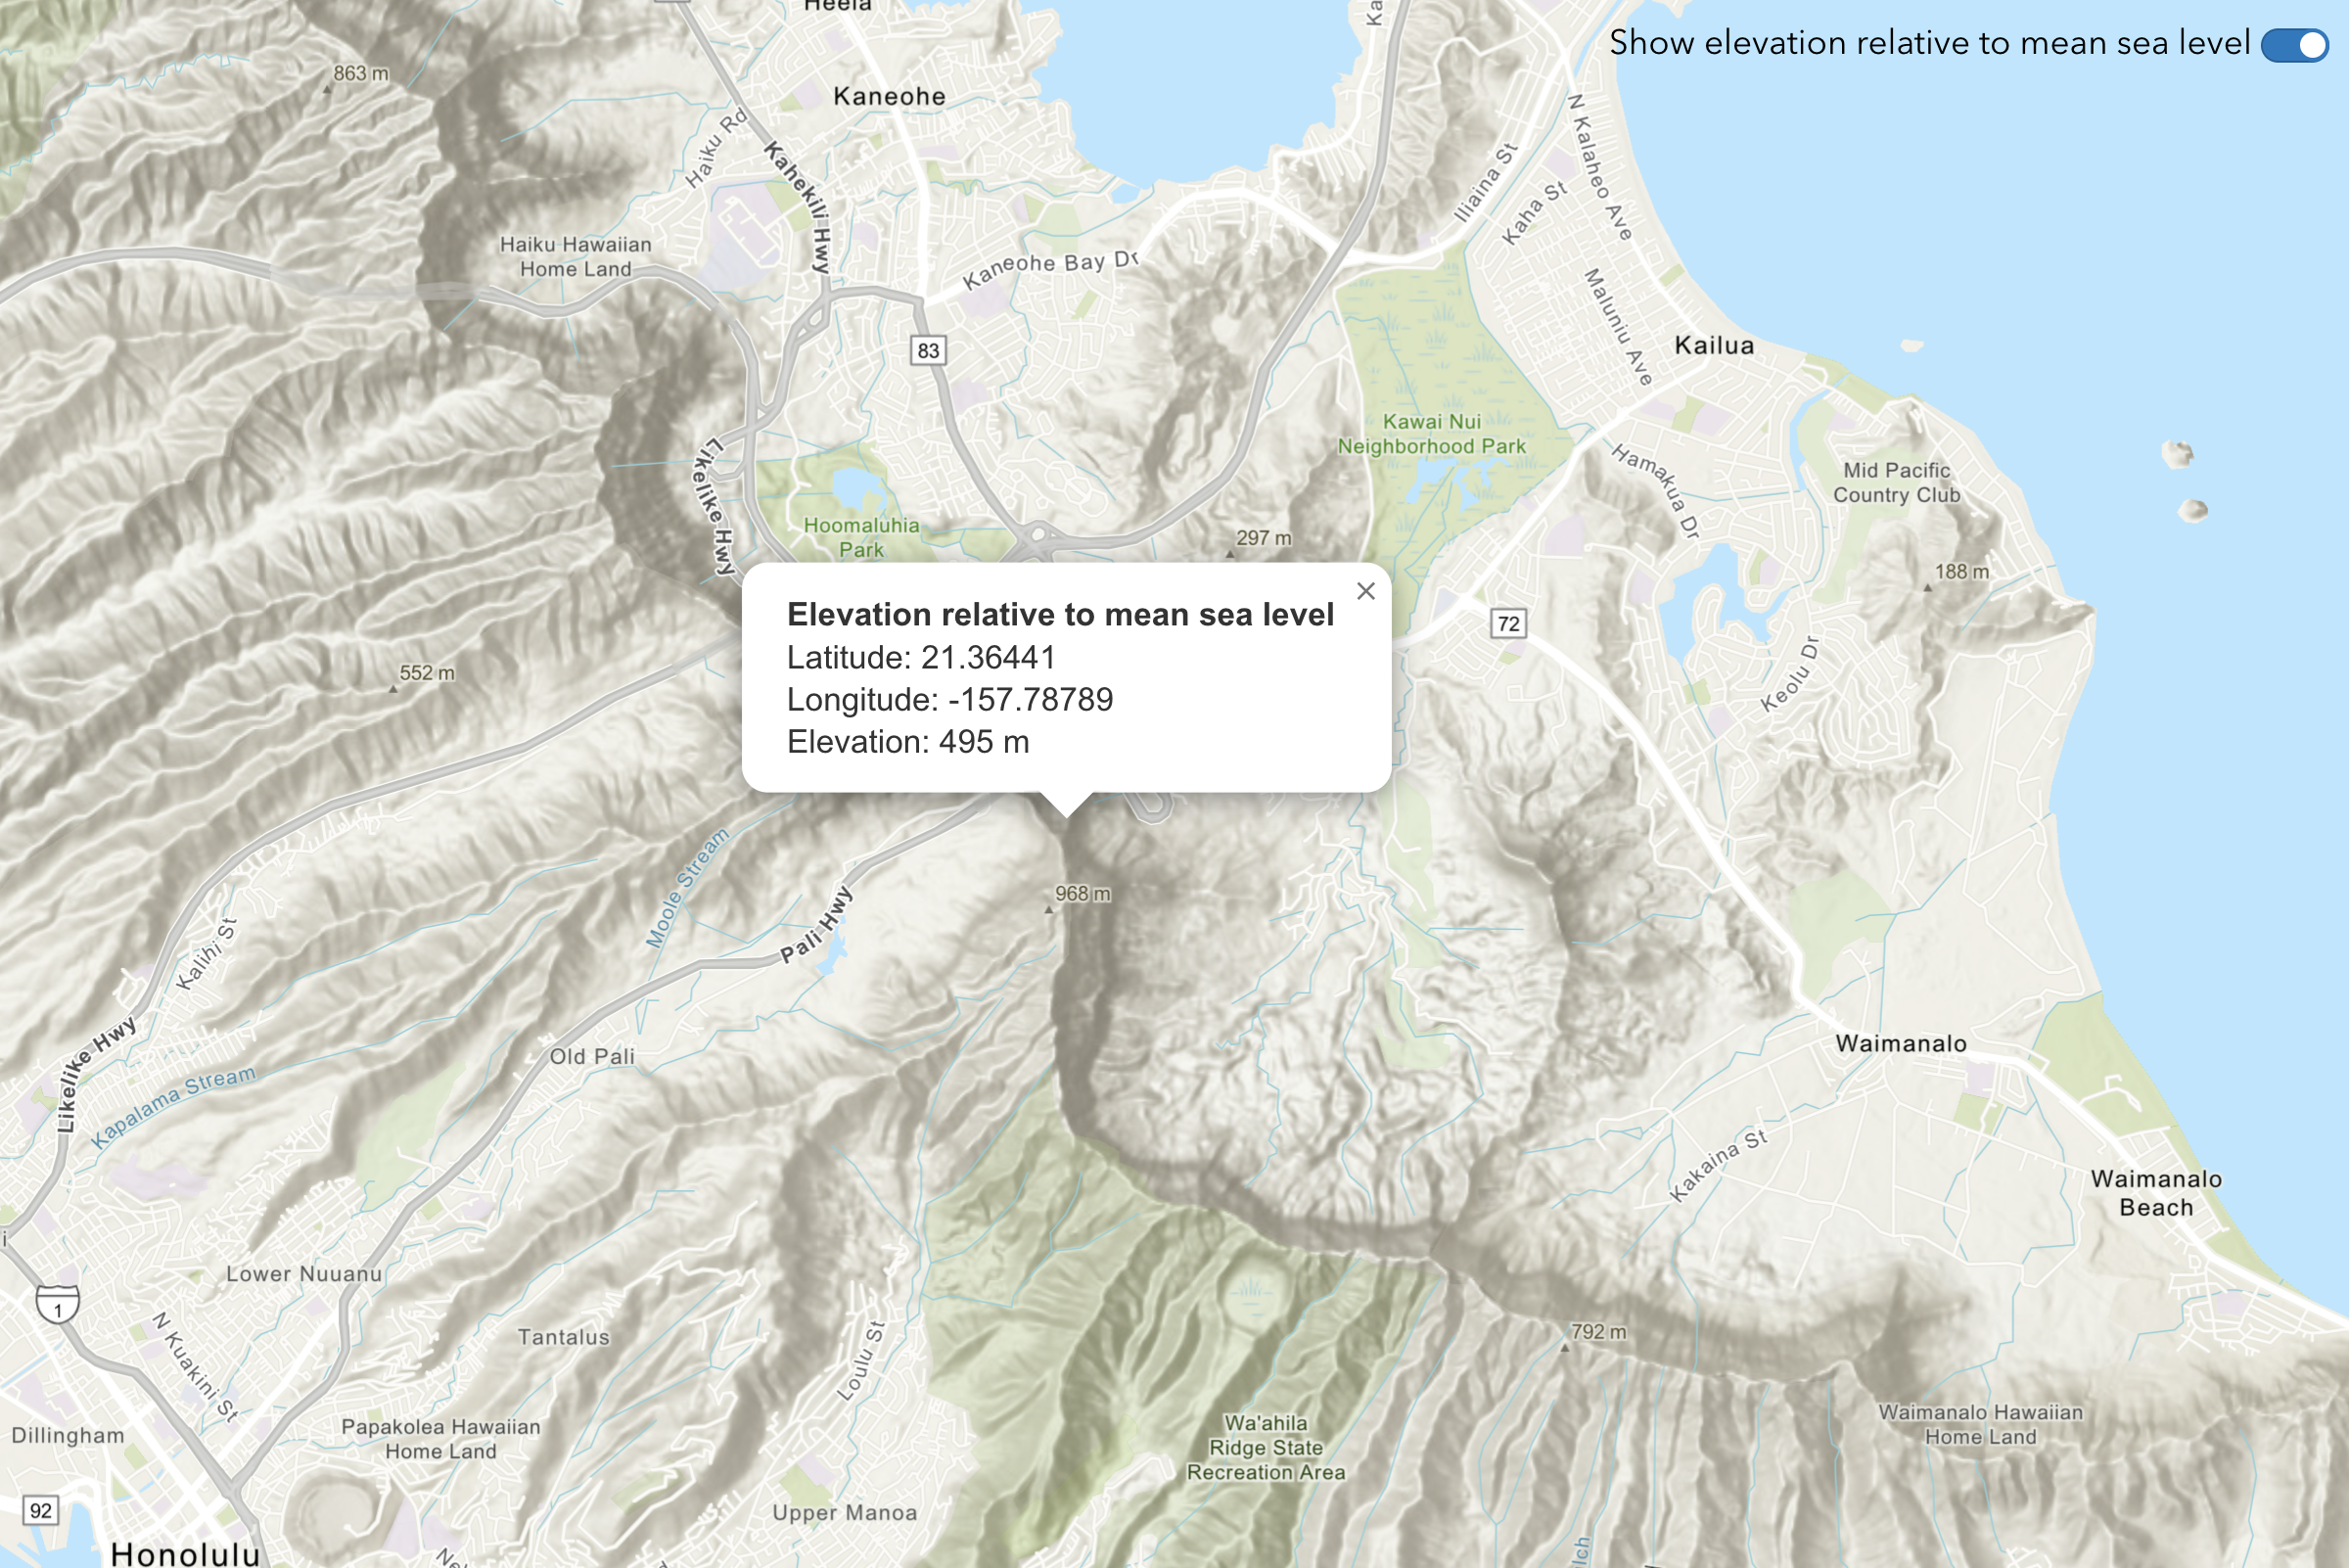
In this tutorial, use the MapLibre ArcGIS plugin to display a map and ArcGIS REST JS to access the Elevation service and get elevation values for points along a path in New Zealand's South Island. The values will be returned as measures above mean sea level in meters.
Prerequisites
You need an ArcGIS Location Platform account.
ArcGIS Online and ArcGIS Enterprise accounts are not supported.
Steps
Get the starter app
Select a type of authentication and follow the steps to create a new app.
Choose API key authentication if you:
- Want the easiest way to get started.
- Want to build public applications that access ArcGIS Location Services and secure items.
- Have an ArcGIS Location Platform or ArcGIS Online account.
Choose user authentication if you:
- Want to build private applications.
- Require application users to sign in with their own ArcGIS account and access resources their behalf.
- Have an ArcGIS Online account.
To learn more about both types of authentication, go to Authentication.
Set up authentication
Set developer credentials
Use the API key or OAuth developer credentials so your application can access ArcGIS services.
Update the map
-
Set the basemap to
arcgis/topographicdisplay topographic details.Use dark colors for code blocks Copy const basemapStyle = maplibreArcGIS.BasemapStyle.applyStyle(map, { style: "arcgis/topographic", token: accessToken }); -
To focus on South Island, New Zealand, update the map's center to
169.0016, -44.6323and set the zoom level to10.Use dark colors for code blocks Copy const map = new maplibregl.Map({ container: "map", zoom: 10, center: [169.0016, -44.6323] });
Define points of interest
You need to define the coordinates of interest from Kingston to Frankton in New Zealand's South Island, passing through the Lake Wakatipu. You then draw a polyline connecting these points to visualize the route on the map.
-
Define a set of points starting from Kingston, passing through Lake Wakatipu, and reaching Frankton.
Use dark colors for code blocks const points = [ [168.957299, -44.665736], [168.970268, -44.655672], [168.993555, -44.645187], [169.007703, -44.630505], [168.999450, -44.609314], [169.026863, -44.610783], [169.056045, -44.609104] ]; -
Draw a line to connect the points and add it to the map.
Use dark colors for code blocks map.once("load", () => { const coordinates = points.map(([lng, lat]) => [lng, lat]); map.addSource("line", { type: "geojson", data: { type: "Feature", geometry: { type: "LineString", coordinates: coordinates } } }); map.addLayer({ id: "line", type: "line", source: "line" }); }); -
Using
Markerraw a marker on each point and add it to the map.Use dark colors for code blocks map.once("load", () => { const coordinates = points.map(([lng, lat]) => [lng, lat]); map.addSource("line", { type: "geojson", data: { type: "Feature", geometry: { type: "LineString", coordinates: coordinates } } }); map.addLayer({ id: "line", type: "line", source: "line" }); coordinates.forEach(([lng, lat]) => { new maplibregl.Marker() .setLngLat([lng, lat]) .addTo(map); }); });
Get elevation data
After defining the points and drawing the route, make a request to the Elevation service to get the elevations of the points along the route.
-
Define a function called
fetchand call it.Elevation Data() Use dark colors for code blocks async function fetchElevationData() { } -
Use ArcGIS REST JS
findmethod to call the Elevation service and pass in the array of points.Elevation At Many Points Use dark colors for code blocks async function fetchElevationData() { const data = await arcgisRest.findElevationAtManyPoints({ coordinates: points, authentication: arcgisRest.ApiKeyManager.fromKey(accessToken) }); }
Display results
Once the elevation data is fetched, you can display the results on the map. This involves extracting the elevation values from the response and creating a marker at each point to show the elevation information.
-
Extract the
zvalues from the service response to be used for displaying the elevation at each point.Use dark colors for code blocks async function fetchElevationData() { const data = await arcgisRest.findElevationAtManyPoints({ coordinates: points, authentication: arcgisRest.ApiKeyManager.fromKey(accessToken) }); const elevationValues = data.result.points; } -
Use
Popupto show a popup on top of each marker with the elevation value.Use dark colors for code blocks async function fetchElevationData() { const data = await arcgisRest.findElevationAtManyPoints({ coordinates: points, authentication: arcgisRest.ApiKeyManager.fromKey(accessToken) }); const elevationValues = data.result.points; elevationValues.forEach((elevationData) => { const { x, y, z } = elevationData; new maplibregl.Popup({ closeButton: false }) .setLngLat([x, y]) .setHTML(`${z} m`) .setOffset(40) .addTo(map); }); }
Run the app
Run the app.
You should now see a map centered over New Zealand's South Island with elevation values shown along the path.What's next?
Learn how to use additional location services in these tutorials: