Learn how to query global demographic information for locations around the world with the GeoEnrichment service.
The GeoEnrichment service provides global demographic data for 170 countries and regions. To get globally available information, you use the Key data collection, which returns information for the total population, total households, average household size, and total population for males and females for a study area.
In this tutorial, you use the GeoEnrichment service and display global data for a point near London, England.
Prerequisites
The ArcGIS API for Python tutorials use Jupyter Notebooks to execute Python code. If you are new to this environment, please see the guide to install the API and use notebooks locally.
Steps
Import modules and log in
-
Import the
GISclass from thearcgis.gismodule. TheGISclass provides helper objects to manage (search, create, retrieve) GIS resources such as content, users, and groups. Additionally, import theGeometryandPointclasses from thearcgis.geometrymodule and theenrichmethod from thearcgis.geoenrichmentmodule.Use dark colors for code blocks from arcgis.gis import GIS from arcgis.geometry import Geometry, Point from arcgis.features import FeatureCollection, FeatureSet from arcgis.geoenrichment import BufferStudyArea, Country, enrich -
Log in to ArcGIS Online using your credentials. In hosted notebooks, You can use the "home" parameter to use the credentials of the currently logged in account.
Use dark colors for code blocks from arcgis.gis import GIS from arcgis.geometry import Geometry, Point from arcgis.features import FeatureCollection, FeatureSet from arcgis.geoenrichment import BufferStudyArea, Country, enrich portal = GIS("home") print(f"Connected to {portal.properties.name} as {portal.properties.user.username}")
Create study area point
-
Use the
Pointclass to construct a point geometry by passing in the coordinates and spatial reference representing a location in London, England.Use dark colors for code blocks portal = GIS("home") print(f"Connected to {portal.properties.name} as {portal.properties.user.username}") study_area_pt = Point( {"x": 0.1278, "y": 51.5074, "spatialReference": {"wkid": 4326}} ) # London, England
Get demographic data
-
Use the
enrichfunction, passing in the study area point and the data collection text string of `KeyGlobalFacts to get the demographic data. To learn more about data collections, goto the data enrichment section of this guide.Use dark colors for code blocks study_area_pt = Point( {"x": 0.1278, "y": 51.5074, "spatialReference": {"wkid": 4326}} ) # London, England enrichment_results = enrich( study_areas=[study_area_pt], data_collections=["KeyGlobalFacts"] ) enrichment_results enriched_features = FeatureSet.from_dataframe(enrichment_results) enriched_features
Display the results
-
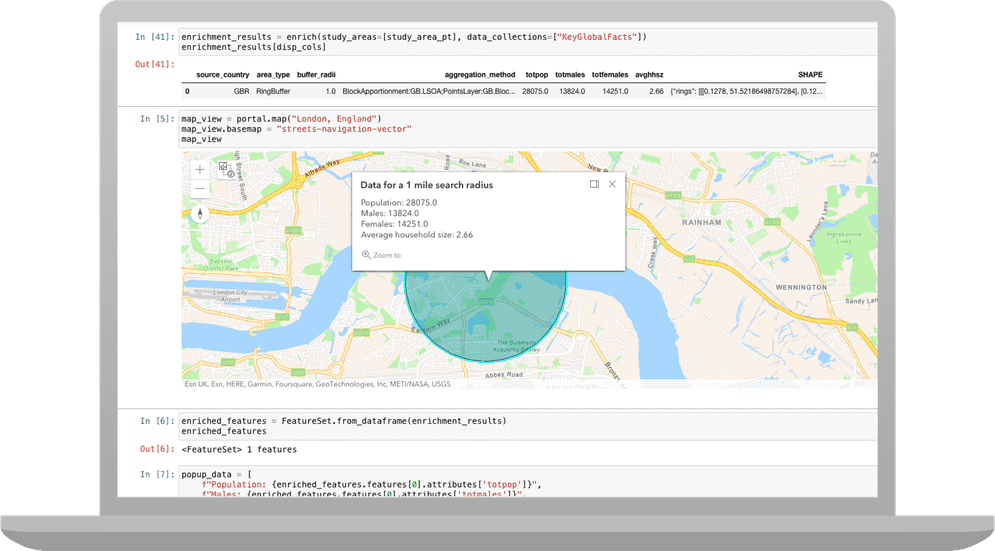
Create a
mapand set it'sbasemapto "streets-navigation-vector".Use dark colors for code blocks enrichment_results = enrich( study_areas=[study_area_pt], data_collections=["KeyGlobalFacts"] ) enrichment_results enriched_features = FeatureSet.from_dataframe(enrichment_results) enriched_features map_view = portal.map("London, England") map_view.basemap = "streets-navigation-vector" map_view -
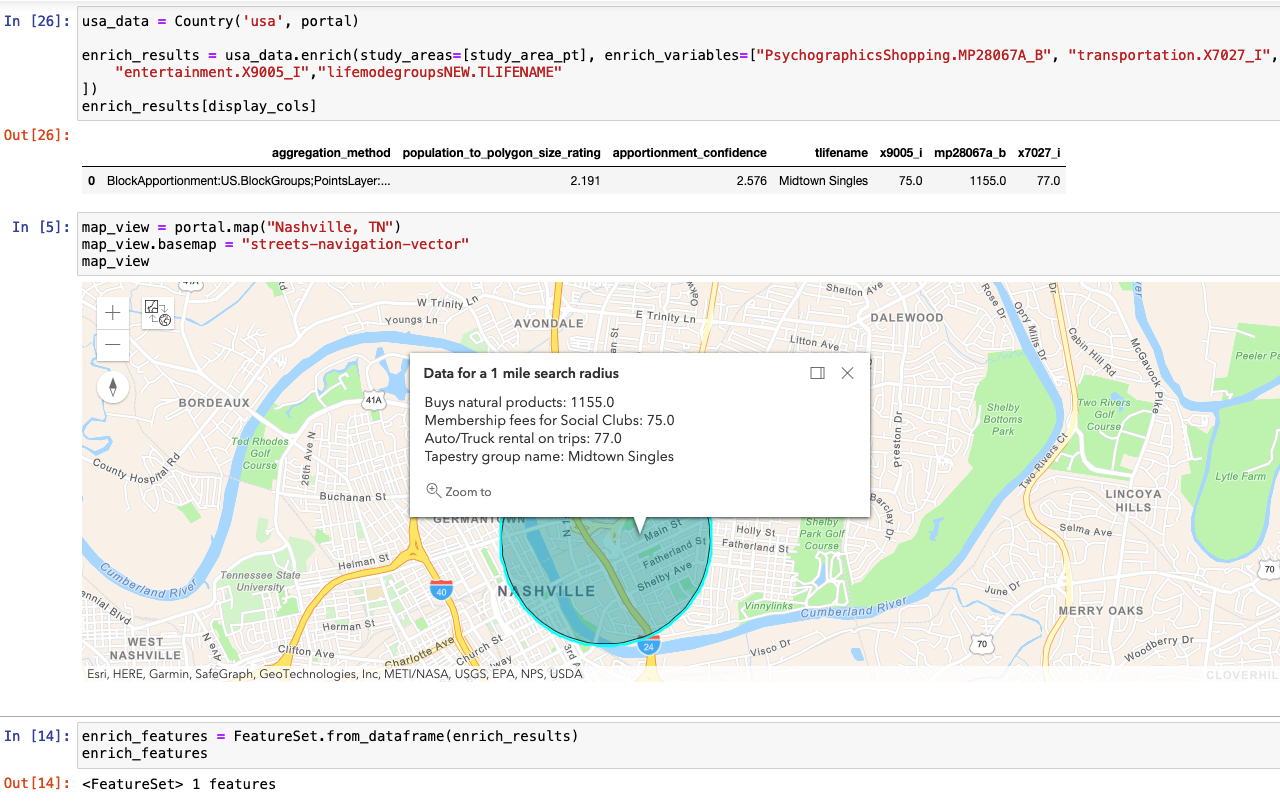
Use the enrichment results to construct a popup object.
Use dark colors for code blocks popup_data = [ f"Population: {enriched_features.features[0].attributes['totpop']}", f"Males: {enriched_features.features[0].attributes['totmales']}", f"Females: {enriched_features.features[0].attributes['totfemales']}", f"Average household size: {enriched_features.features[0].attributes['avghhsz']}", ] popup_info = { "title": "<b>Data for a 1 mile search radius</b>", "content": "<br>".join(popup_data), } -
Call the
clear_method to remove any previous graphics from the map. Use thegraphics drawmethod and pass in the enriched geomety and popup info to add the results to the map. Set theextentof the map to the result geometry's extent.Use dark colors for code blocks popup_data = [ f"Population: {enriched_features.features[0].attributes['totpop']}", f"Males: {enriched_features.features[0].attributes['totmales']}", f"Females: {enriched_features.features[0].attributes['totfemales']}", f"Average household size: {enriched_features.features[0].attributes['avghhsz']}", ] popup_info = { "title": "<b>Data for a 1 mile search radius</b>", "content": "<br>".join(popup_data), } map_view.clear_graphics() map_view.draw(enriched_features.features[0].geometry, popup=popup_info) map_view.extent = Geometry(enriched_features.features[0].geometry).extent
You should now see a map centered around London, England with a polygon graphic representing a 1 mile radius around the study area point. Click on the graphic to display a popup to view global demographic values.
What's next?
Learn how to use additional functionality in these tutorials: