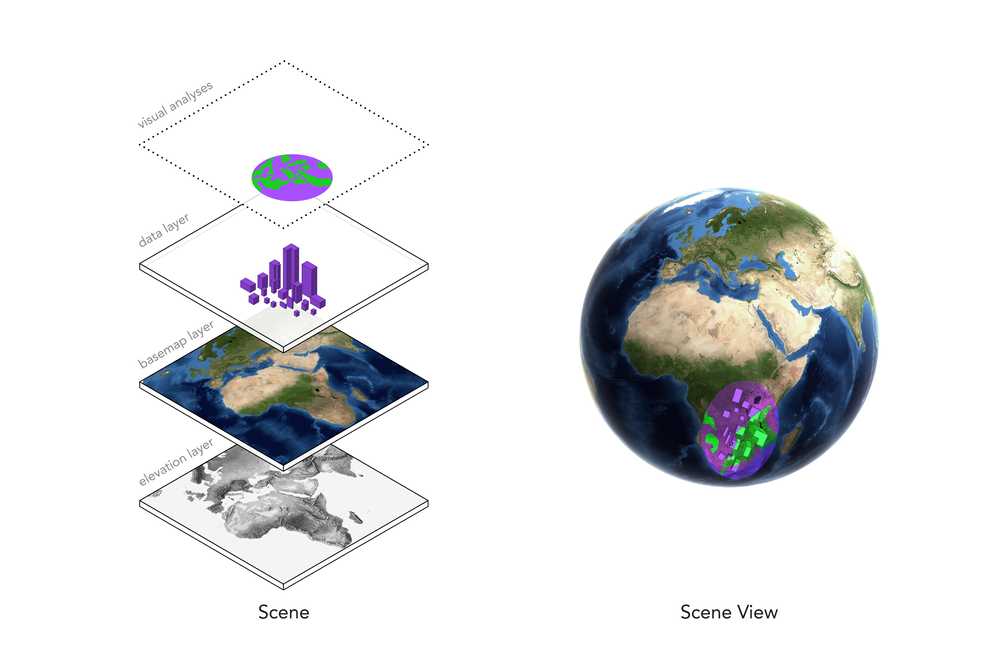
What is 3D visual analysis?
A 3D visual analysis is a type of spatial analysis that calculates and displays spatial information derived from the terrain, buildings, and other 3D objects contained within a scene. 3D visual analysis consists of two major classes of analysis: visibility analyses which determine what is visible from a certain point and measurement analyses which determine the physical dimensions of 3D elements.
3D visual analysis is typically an interactive process and the results can be updated as the user input and environment change. When an analysis is complete, the results can be displayed on a scene to solve problems and gain a better understanding of complex 3D environments.
Why use 3D visual analysis?
You can use 3D visual analyses to:
- Display the visibility (viewshed) of surface terrain and 3D objects from a viewpoint.
- Calculate and display the visibility of a target from an observer.
- Dynamically make line-of-sight and visibility calculations.
- Measure the vertical, horizontal, and direct distance between two points.
- Measure the area and perimeter of a polygon.
Types of 3D visual operations
| Category | Description | Operations | Results | Example |
|---|---|---|---|---|
| Viewshed | Calculates and displays the visibility of surroundings from an observer's perspective in a scene. Only available with the ArcGIS Maps SDKs for Native Apps. | Location, Location, Geo | A viewshed overlay representing what can and cannot be seen by an observer. |

|
| Line of sight | Calculates if a target location is visible from an observer location in a scene. | Location, Geo | A line indicating visibility, divided into segments based on what can be seen and what is obstructed. |

|
| Distance Measurement | Calculates and displays the distance between two points in a scene. | Location, Direct | An overlay containing a line feature and its corresponding distance measurement. |

|
| Area Measurement | Calculates and displays the area of a polygon in a scene. | Area | An overlay containing a polygon feature and its corresponding area measurement. |

|
Tutorials

Display a viewshed
Perform and display a viewshed analysis in a 3D scene.

Display a line of sight
Perform and display a line of sight analysis in a 3D scene.

Measure a distance in 3D
Evaluate the horizontal, vertical, and direct distances between two points in a 3D scene.
API support
| Viewshed analysis | Line of sight analysis | Distance measurement | Area measurement | |
|---|---|---|---|---|
| ArcGIS Maps SDK for JavaScript | 1 | 2 | ||
| ArcGIS Maps SDK for .NET | ||||
| ArcGIS Maps SDK for Kotlin | ||||
| ArcGIS Maps SDK for Swift | ||||
| ArcGIS Maps SDK for Flutter | ||||
| ArcGIS Maps SDK for Java | ||||
| ArcGIS Maps SDK for Qt | ||||
| ArcGIS API for Python | ||||
| ArcGIS REST JS | ||||
| Leaflet | ||||
| MapLibre GL JS | ||||
| OpenLayers |
- 1. Supports point location viewshed
- 2. Supports point location line of sight
Tool support
| Viewshed analysis | Line of sight analysis | Distance measurement | Area measurement | |
|---|---|---|---|---|
| ArcGIS Pro | ||||
| ArcGIS Scene Viewer |