Introduction
Much of the grazing in the state of Oregon occurs on federal lands. Grazing areas are divided into allotments by federal agencies. They issue permits or leases to ranchers for individual grazing allotments.
Studies by the state of Oregon Department of Environment Quality (DEQ) indicate that streams located in grazing areas are majorly polluted by sediments and animal waste. This is a substantial concern as it causes degradation of water quality, threatening human and ecological health. The department thus wants to inspect the effect of livestock grazing on the state’s water quality.
While federal agencies manage the grazing lands by allotments, the state's biologists monitor water quality by watersheds, or hydrologic basins (as the hydrologists refer to them). If a basin has water quality issues, then biologists who monitor water quality for watersheds or hydrologic basins could identify all grazing allotments that are in that basin. They can then work with federal agencies who manages the grazing allotments to ensure that permit holders are conforming to best practices.

Grazing allotments and hydrologic basin boundaries. Many allotments fall in more than one hydrologic basin.
Since grazing allotments were not created with basin boundaries in mind, an allotment can fall completely within a hydrologic basin, or can cross basin boundaries, falling in two or more basins.
This sample uses ArcGIS API for Python to find out which watershed, or watersheds, each grazing allotment falls in, for water quality monitoring.
It demonstrates using tools such as overlay_layers to identify allotments in a particular basin. This will assign each allotment to the hydrologic basins it falls within.
Moreover, in order to successfully identify the source of pollution in each basin, each basin is assigned the grazing allotment name and the number of streams within. This will help identify which allotment each segment of each stream passes through. If field tests find a water quality issue with a particular stream, biologists can link back to the federal database and get a report on each suspect allotment (the type and number of livestock, the owner information, the administrating office, and so on). The information will help them determine the source of pollution.
Workflow

Necessary Imports
%matplotlib inline

import pandas as pd
pd.set_option('mode.chained_assignment', None)
import matplotlib.pyplot as plt
from IPython.display import display
from datetime import datetime as dt

from arcgis.gis import GIS
from arcgis.features.manage_data import overlay_layers
Connect to your GIS
Connect to our GIS via an existing profile or creating a new connection by e.g. gis = GIS("https://www.arcgis.com", "arcgis_python", "P@ssword123")
gis = GIS('home')Get data for analysis
Search for grazing allotments and watersheds layer in ArcGIS Online.
items = gis.content.search('grazing allotments and watersheds owner: api_data_owner',
                           'Feature Layer')
The code below displays the items.
for item in items:
    display(item)
We will use the first item for our analysis. Since the item is a Feature Layer Collection, accessing the layers property will give us a list of FeatureLayer objects.
data = items[0]The code below cycles through the layers and prints their names.
for lyr in data.layers:
    print(lyr.properties.name)
hydro_units counties grazing_allotments streams
Let us now get the layers and assign a variable to them.
hydro_units = data.layers[0]counties = data.layers[1]grazing_allotments = data.layers[2]streams = data.layers[3]map1 = gis.map("Oregon")
map1
map1.add_layer(hydro_units)
map1.add_layer(grazing_allotments)
Assigning basin information to allotments
In order to find out which hydrologic basins each grazing allotment is in, we will use overlay_layers tool. It combines two layers, an analysis layer and an overlay layer, into a new layer, creating new features and combining attributes from the two layers according to the overlay method selected. Overlay operations supported are Intersect, Union, and Erase.
We will overlay grazing allotments with hydrologic basins using the Intersect option.
basin_overlay = overlay_layers(grazing_allotments,
                               hydro_units,
                               overlay_type='Intersect',
                               output_name="OverlayAllotmentWithBasin" + str(dt.now().microsecond))
basin_overlay
map2 = gis.map('Oregon')
map2
map2.add_layer(basin_overlay.layers[0])The new features have all the attributes of the features in the input layers. In this case, the new allotment features are assigned the attributes-including the name and ID-of the hydrologic basin they fall within. Allotments that fall in two or more basins are split at the basin boundaries and the corresponding attributes assigned to each portion of the allotment.
Mapping and exploring basin overlay results
We will explore overlay results using both matplotlib and plot method of Spatially Enabled Dataframe.
Let's read the overlay layer as Spatially Enabled DataFrame.
sdf = pd.DataFrame.spatial.from_layer(basin_overlay.layers[0])slctd_cols = ['BASIN_NAME', 'allot_name', 'allot_no', 'REGION', 'HUC', 'SHAPE']basin_overlay_df = sdf[slctd_cols]basin_overlay_df.head()| BASIN_NAME | allot_name | allot_no | REGION | HUC | SHAPE | |
|---|---|---|---|---|---|---|
| 0 | COQUILLE | WICKENS/BAXTER | 20001 | 17 | 17100305 | {"rings": [[[-13812226.4688, 5342337.4032], [-... |
| 1 | UMPQUA | KELLOGG | 10007 | 17 | 17100303 | {"rings": [[[-13752329.3678, 5398012.2305], [-... |
| 2 | COQUILLE | PRINCEOTTO/CAWTHON | 20001 | 17 | 17100305 | {"rings": [[[-13803327.8105, 5347044.5693], [-... |
| 3 | UMPQUA | BULLOCK | 20006 | 17 | 17100303 | {"rings": [[[-13752015.6692, 5396937.5365], [-... |
| 4 | LOST | JOHNSON | 00833 | 18 | 18010204 | {"rings": [[[-13504148.0167, 5160990.0443], [-... |
We will group the dataframe by 'BASIN_NAME'. To get the number of basins in each group we will use the size() method.
grp_basin = basin_overlay_df.groupby('BASIN_NAME').size()grp_basin.head()BASIN_NAME ALVORD LAKE 51 APPLEGATE 2 BEAVER-SOUTH FORK 52 BROWNLEE RESERVOIR 52 BULLY 29 dtype: int64
grp_basin.nlargest(10)BASIN_NAME POWDER 156 BURNT 146 LOWER JOHN DAY 128 UPPER MALHEUR 122 LOST 84 LOWER CROOKED 72 HARNEY-MALHEUR LAKES 71 SUMMER LAKE 69 UPPER CROOKED 65 WILLOW 62 dtype: int64
grp_basin.nlargest(10).plot(kind='barh')<matplotlib.axes._subplots.AxesSubplot at 0x1984f3484a8>
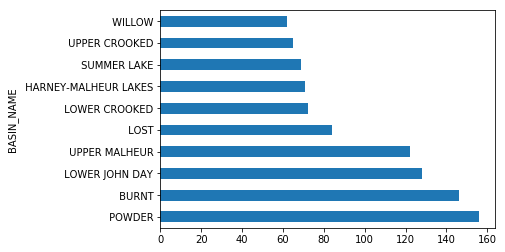
We see that Powder Basin intersected the largest number of grazing allotments, followed by Burnt and Lower John Day basins.
We will now map grazing allotments by hydrologic basin.
map3 = gis.map('oregon')
map3
Grazing allotments are color coded by the basin they are in. Allotment features are split where a basin boundary crosses them. Selecting an allotment feature displays the allotment and basin information--the basin information is associated with the feature.
basin_overlay_df.spatial.plot(kind='map',
                              map_widget=map3,
                              renderer_type='u',
                              col='BASIN_NAME')
True
Display grazing allotments within a particular basin
Let's get a list of all basin names.
basin_overlay_df.BASIN_NAME.str.strip().unique()array(['COQUILLE', 'UMPQUA', 'LOST', 'GOOSE LAKE', ..., 'MIDDLE SNAKE-SUCCOR', 'THOUSAND-VIRGIN', 'SOUTH FORK OWYHEE',
'KLICKITAT'], dtype=object)We will apply a filter to visualize grazing allotments within a particular basin.
john_day_df = basin_overlay_df[basin_overlay_df['BASIN_NAME'] == ' MIDDLE FORK JOHN DAY']john_day_df| BASIN_NAME | allot_name | allot_no | REGION | HUC | SHAPE | |
|---|---|---|---|---|---|---|
| 58 | MIDDLE FORK JOHN DAY | MIDDLE FORK | 04014 | 17 | 17070203 | {"rings": [[[-13234233.0817, 5586868.7282], [-... |
| 238 | MIDDLE FORK JOHN DAY | SIDEHILL | 04026 | 17 | 17070203 | {"rings": [[[-13238795.622, 5579105.8225], [-1... |
| 280 | MIDDLE FORK JOHN DAY | GIBSON CREEK | 04135 | 17 | 17070203 | {"rings": [[[-13263280.5074, 5602968.1923], [-... |
| 552 | MIDDLE FORK JOHN DAY | PASS CREEK | 04184 | 17 | 17070203 | {"rings": [[[-13268669.5057, 5592601.4069], [-... |
| 754 | MIDDLE FORK JOHN DAY | NORTH FORK | 04029 | 17 | 17070203 | {"rings": [[[-13278826.6115, 5607309.3595], [-... |
| 802 | MIDDLE FORK JOHN DAY | JINKS CREEK | 04050 | 17 | 17070203 | {"rings": [[[-13282326.8528, 5597674.5336], [-... |
| 862 | MIDDLE FORK JOHN DAY | WEST FORK BURNT RIVER | 15324 | 17 | 17070203 | {"rings": [[[-13170488.1642, 5557278.5571], [-... |
| 871 | MIDDLE FORK JOHN DAY | MUD SPRINGS | 04015 | 17 | 17070203 | {"rings": [[[-13269728.7602, 5614038.7], [-132... |
| 985 | MIDDLE FORK JOHN DAY | NORTH FORK BURNT RIVER (USFS) | 15329 | 17 | 17070203 | {"rings": [[[-13179809.2132, 5565524.2035], [-... |
| 989 | MIDDLE FORK JOHN DAY | DOHERTY P JOE SHEEP | 04193 | 17 | 17070203 | {"rings": [[[-13251986.3822, 5614102.6014], [-... |
| 1152 | MIDDLE FORK JOHN DAY | SLICKEAR MTN. | 04003 | 17 | 17070203 | {"rings": [[[-13269794.5899, 5593722.8408], [-... |
Let's plot the filtered results on map.
map4 = gis.map('oregon', zoomlevel=8)
map4
Grazing allotments are filtered by a particular hydrologic basin (Middle Fork John Day). The map shows all the allotments (or portions of allotments) that are in the basin, and the table above lists them with the associated information.
map4.center = [44.88, -118.83]map4.add_layer(hydro_units)john_day_df.spatial.plot(map_widget=map4)True
Display a particular grazing allotment to see which basins intersect it
We will filter grazing allotments using allotment number 04003.
allot_df = basin_overlay_df[basin_overlay_df['allot_no'] == '04003']allot_df| BASIN_NAME | allot_name | allot_no | REGION | HUC | SHAPE | |
|---|---|---|---|---|---|---|
| 1152 | MIDDLE FORK JOHN DAY | SLICKEAR MTN. | 04003 | 17 | 17070203 | {"rings": [[[-13269794.5899, 5593722.8408], [-... |
| 1153 | NORTH FORK JOHN DAY | SLICKEAR MTN. | 04003 | 17 | 17070202 | {"rings": [[[-13276660.1969, 5581616.3978], [-... |
map5 = gis.map('oregon', zoomlevel=8)
map5
Grazing allotments are filtered using a particular allotment number (04003). The map shows in which basins the allotment is.
map5.center = [44.88, -118.83]map5.add_layer(hydro_units)allot_df.spatial.plot(map_widget=map5)True
Assigning allotment information to streams
We will again use overlay_layers tool, this time overlaying streams with grazing allotments (area features can be overlaid with line or point features as well as other area features).
We will overlay streams with grazing allotments using the Intersect option. The output layer contains only those stream segments that cross a grazing allotment.
stream_overlay = overlay_layers(streams,
                                grazing_allotments,
                                overlay_type='Intersect',
                                output_name="StreamOverlay" + str(dt.now().microsecond)
                               )
stream_overlay
Read the overlay layer as Spatially Enabled DataFrame.
Mapping and exploring stream overlay results
stdf = pd.DataFrame.spatial.from_layer(stream_overlay.layers[0])cols = ['allot_name', 'allot_no', 'HUC', 'PNAME', 'SHAPE' ]stream_overlay_df = stdf[cols]stream_overlay_df.head()| allot_name | allot_no | HUC | PNAME | SHAPE | |
|---|---|---|---|---|---|
| 0 | BIG SUMMIT WEST | 02580 | 17070304 | JOHNSON CR | {"paths": [[[-13383245.2218, 5520910.6927], [-... |
| 1 | WEIGAND | 00075 | 17070304 | CROOKED R | {"paths": [[[-13401832.2407, 5485427.1285], [-... |
| 2 | WEST PINE CREEK | 00076 | 17070304 | CROOKED R | {"paths": [[[-13401868.5519, 5485480.4708], [-... |
| 3 | NORTH FORK | 04029 | 17070202 | MALLORY CR | {"paths": [[[-13279226.9627, 5616433.4654], [-... |
| 4 | BIG MUDDY | 02512 | 17070204 | *G | {"paths": [[[-13419994.254, 5593063.7317], [-1... |
st_grp = stream_overlay_df.groupby('PNAME').size()st_grp.nlargest(10).plot(kind='barh')<matplotlib.axes._subplots.AxesSubplot at 0x1984be31f98>
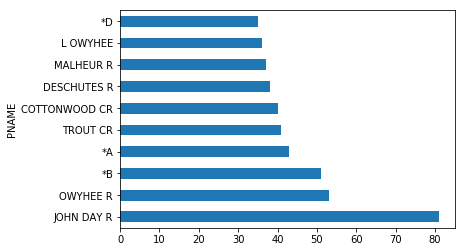
John Day River is the third longest free flowing river in contiguous US. The plot shows that this river is mostly used for ranching.
stream_overlay_df.groupby('allot_name').size().nlargest(10)allot_name THREE FINGERS 36 JACKIES BUTTE SUMMER 23 QUARTZ MOUNTAIN 23 SADDLE BUTTE 23 SUMMIT PRAIRIE 22 WALLROCK 21 G.I. 16 BIG BUTTE 15 BOARD CORRALS 15 COYOTE LAKE 14 dtype: int64
Thirty-six (36) stream segments from 17 different streams pass through the 'THREE FINGERS' grazing allotment.
map6 = gis.map('oregon')
map6
Map of streams overlaid by grazing allotments.
map6.add_layer(grazing_allotments)stream_overlay_df.spatial.plot(kind='map',
map_widget=map6,
renderer_type='u',
col='PNAME') True
Display a stream and grazing allotments it intersects
We will filter the analysis_layer for a specific stream—BRIDGE CR.
creek_df = stream_overlay_df[stream_overlay_df['PNAME'] == 'BRIDGE CR']creek_df.head()| allot_name | allot_no | HUC | PNAME | SHAPE | |
|---|---|---|---|---|---|
| 155 | BURNT RANCH | 02624 | 17070204 | BRIDGE CR | {"paths": [[[-13392864.8203, 5579859.7598], [-... |
| 156 | SUTTON MTN. | 02533 | 17070204 | BRIDGE CR | {"paths": [[[-13392552.7024, 5577996.559], [-1... |
| 771 | UPPER BRIDGE CREEK | 00701 | 17120005 | BRIDGE CR | {"paths": [[[-13488884.9907, 5323673.5952], [-... |
| 772 | BUCK CREEK-BRIDGE CR | 00702 | 17120005 | BRIDGE CR | {"paths": [[[-13485835.5035, 5327100.6087], [-... |
| 875 | RING BUTTE | 10208 | 17050116 | BRIDGE CR | {"paths": [[[-13160937.9964, 5491764.6228], [-... |
map7 = gis.map('oregon')
map7
This map shows in which allotment each stream segment falls.
map7.add_layer(grazing_allotments)creek_df.spatial.plot(map_widget=map7)Conclusion
Biologists can now identify which hydrologic basin and stream(s) intersect with which grazing allotments in an effort to identify sources of chronic water quality issues.