Spatial wildfire occurrence data, referred to as the Fire Program Analysis fire-occurrence database (FPA FOD), for the United States, 1992-2015 was obtained from https://www.fs.usda.gov/rds/archive/Product/RDS-2013-0009.4/. The dataset contains data on:
- 1.88 Million US Wildfires
- 24 years of geo-referenced wildfire records
Given this data, can we answer the following questions?
- Are wildfires increasing over time?
- Where are the fire hot spots?
- Can Machine Learning categorize the cause of the fire given the size, location and date?
That would give investigators a data driven way to prioritize cases for further investigation.
from arcgis import *
import pandas as pd
import numpy as np
gis = GIS(profile='deldev.maps')from arcgis.features import GeoAccessor, GeoSeriesAccessor
wildfires_df = pd.DataFrame.spatial.from_featureclass(r'C:\demo\FPA_FOD_20170508.gdb\Fires')wildfires_df.shape(1880465, 39)
df = wildfires_df[['FIRE_YEAR', 'DISCOVERY_DATE', 'DISCOVERY_DOY',
'STAT_CAUSE_DESCR', 'FIRE_SIZE', 'STATE', 'FIPS_CODE', 'FIPS_NAME', 'SHAPE']]df.head()| FIRE_YEAR | DISCOVERY_DATE | DISCOVERY_DOY | STAT_CAUSE_DESCR | FIRE_SIZE | STATE | FIPS_CODE | FIPS_NAME | SHAPE | |
|---|---|---|---|---|---|---|---|---|---|
| 0 | 2005 | 2005-02-02 | 33 | Miscellaneous | 0.10 | CA | 063 | Plumas | {'x': -121.00583333000003, 'y': 40.03694443999... |
| 1 | 2004 | 2004-05-12 | 133 | Lightning | 0.25 | CA | 061 | Placer | {'x': -120.40444444000002, 'y': 38.93305556000... |
| 2 | 2004 | 2004-05-31 | 152 | Debris Burning | 0.10 | CA | 017 | El Dorado | {'x': -120.73555555999997, 'y': 38.98416666999... |
| 3 | 2004 | 2004-06-28 | 180 | Lightning | 0.10 | CA | 003 | Alpine | {'x': -119.91333333, 'y': 38.55916666999997, '... |
| 4 | 2004 | 2004-06-28 | 180 | Lightning | 0.10 | CA | 003 | Alpine | {'x': -119.93305555999996, 'y': 38.55916666999... |
Exploratory Data Analysis
df['x'] = df.SHAPE.apply(lambda g: g['x'])
df['y'] = df.SHAPE.apply(lambda g: g['y'])
smdf = wildfires_df[['FIRE_YEAR', 'DISCOVERY_DATE', 'DISCOVERY_DOY',
       'STAT_CAUSE_DESCR', 'FIRE_SIZE', 'STATE', 'FIPS_CODE', 'FIPS_NAME', 'x', 'y']]
smdf.to_pickle('fires.pkl')
pd.options.mode.chained_assignment = None
df['MONTH'] = pd.DatetimeIndex(df['DISCOVERY_DATE']).month
df['DAY_OF_WEEK'] = df['DISCOVERY_DATE'].dt.dayofweek
df_arson = df[df['STAT_CAUSE_DESCR']=='Arson']
dfa = df_arson['DAY_OF_WEEK'].value_counts()
df_lightning = df[df['STAT_CAUSE_DESCR']=='Lightning']
dfl = df_lightning['DAY_OF_WEEK'].value_counts()%matplotlib inline
import matplotlib.pyplot as plt
plt.style.use('ggplot')
sorted_df = df.sort_values('FIRE_YEAR')
fire_freq = sorted_df.groupby('FIRE_YEAR').count()
x = np.asarray(fire_freq.axes[0])
y = np.asarray(df.groupby('FIRE_YEAR').size())lyr = gis.content.search('Demographic Profile')[0]
lyr
Have wildfires become more frequent over time?
fig, ax = plt.subplots(figsize=(10,6))
ax.bar(x, y, color='coral')
plt.title('Number of fires by year', y=-0.2)
fit1 = np.polyfit(x, y, deg=1)
ax.plot(x, x*fit1[0] + fit1[1], color='teal', linewidth=4);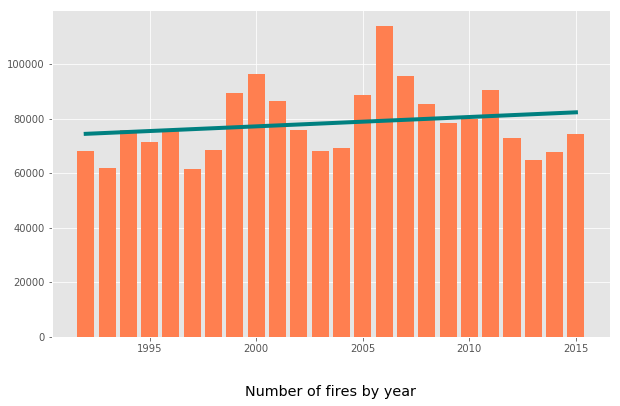
What are the causes of wildfire?
distribution = df['STAT_CAUSE_DESCR'].value_counts()plt.figure(figsize=(6,6))
plt.title('Distribution by cause', y=-0.15)
plt.pie(distribution, labels=list(distribution.index[:-2]) + ['', '']);
plt.axis('equal');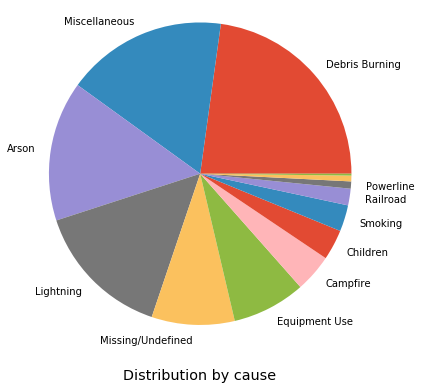
Does the day of week matter?
ind = np.arange(7)
width = 0.35

fig, ax   = plt.subplots(figsize=(10,6))
arson     = ax.bar(ind, dfa.sort_index(), width, color='coral')
lightning = ax.bar(ind + width, dfl.sort_index(), width, color='teal')

ax.set_title('Wildfires by day of week', y=-0.15)
ax.set_xticklabels(('', 'Mon', 'Tues', 'Wed', 'Thu', 'Fri', 'Sat', 'Sun'))
ax.legend((arson[0], lightning[0]), ('Arson', 'Lightning'), loc=2);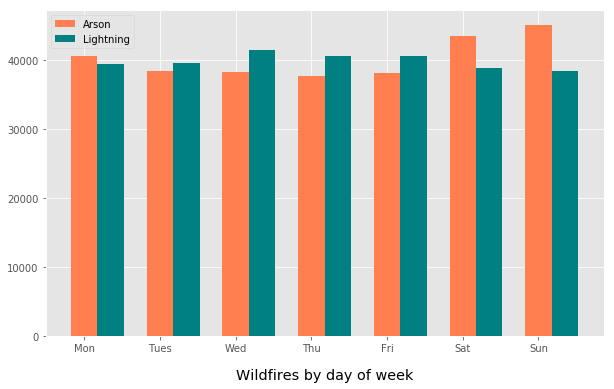
Mapping and Spatial Analysis
wildfires = gis.content.import_data(wildfires_df)from arcgis.features.analysis import find_hot_spots
hotspots = find_hot_spots(wildfires, 20, 'Miles', output_name='Hot Spots US_Historical_Wildfires_20')hotspots = gis.content.get('8f9e60e114c749a9864e4adb9643d096')usmap = gis.map('United States')
usmap.add_layer(hotspots)
usmapCan Machine Learning categorize the cause of the fire?
Since arson is a significant preventable cause for many wildfires, it would be instructive to see if Machine Learning techniques can be used to classify if a fire was caused due to arson given some basic data that is available when the fire is first discovered or when investigations begin. This can be framed as a binary classification problem.
Such a technique could give investigators a data driven way to prioritize cases for further investigation.
from sklearn.model_selection import train_test_split
from sklearn import tree, preprocessing
import sklearn.ensemble as ske
import pandas as pd
import matplotlib.pyplot as plt

%matplotlib inline
%config IPCompleter.greedy=True
df = pd.read_pickle('fires.pkl')
df['MONTH'] = pd.DatetimeIndex(df['DISCOVERY_DATE']).month
df['DAY_OF_WEEK'] = df['DISCOVERY_DATE'].dt.dayofweek
ca_fires = df[df.STATE=='CA']
ca_fires['ARSON'] = ca_fires['STAT_CAUSE_DESCR'].apply(lambda x: 1 if x == 'Arson' else 0)
pdf = ca_fires[ ['FIRE_YEAR', 'DISCOVERY_DOY', 'FIPS_CODE', 'FIRE_SIZE', 'x', 'y', 'MONTH', 'DAY_OF_WEEK', 'ARSON'] ]
pdf = pdf.dropna()Feature Engineering: Use geoenrichment to add features
analysis_variables = [
    'TOTPOP_CY',  # 2016 Population: Total Population (Esri)
    'HHPOP_CY',   # 2016 Household Population (Esri)
    'FAMPOP_CY',  # 2016 Family Population (Esri)
    'DIVINDX_CY', # 2016 Diversity Index (Esri)
    'TOTHH_CY',   # 2016 Total Households (Esri)
    'AVGHHSZ_CY', # 2016 Average Household Size (Esri)

    'MALES_CY',   # 2016 Gender: Male Population (Esri)
    'FEMALES_CY', # 2016 Gender: Female Population (Esri)

    'MEDAGE_CY',  # 2016 Age: Median Age (Esri)

    'AVGFMSZ_CY', # 2016 Income: Average Family Size (Esri)
    'MEDHINC_CY', # 2016 Income: Median Household Income (Esri)
    'AVGHINC_CY', # 2016 Income: Average Household Income (Esri)

    'EDUCBASECY', # 2016 Educational Attainment Base (Esri)
    'NOHS_CY',    # 2016 Education: Less than 9th Grade (Esri)
    'SOMEHS_CY',  # 2016 Education: 9-12th Grade/No Diploma (Esri)
    'HSGRAD_CY',  # 2016 Education: High School Diploma (Esri)
    'GED_CY',     # 2016 Education: GED/Alternative Credential (Esri)
    'SMCOLL_CY',  # 2016 Education: Some College/No Degree (Esri)
    'ASSCDEG_CY', # 2016 Education: Associate's Degree (Esri)
    'BACHDEG_CY', # 2016 Education: Bachelor's Degree (Esri)
]
from arcgis.geoenrichment import *
usa = Country.get('US')
counties = usa.subgeographies.states['California'].counties
enrich_df = enrich(list(counties.values()), analysis_variables=analysis_variables)
pdf['StdGeographyID'] = '06' + pdf['FIPS_CODE']
merged = pd.merge(pdf, enrich_df, on='StdGeographyID')
cols = ['FIRE_YEAR', 'DISCOVERY_DOY', 'FIPS_CODE', 'FIRE_SIZE', 'x', 'y', 'MONTH', 'DAY_OF_WEEK', 'ARSON'] + analysis_variables
mdf = merged[cols]
mdf.head()| FIRE_YEAR | DISCOVERY_DOY | FIPS_CODE | FIRE_SIZE | x | y | MONTH | DAY_OF_WEEK | ARSON | TOTPOP_CY | ... | MEDHINC_CY | AVGHINC_CY | EDUCBASECY | NOHS_CY | SOMEHS_CY | HSGRAD_CY | GED_CY | SMCOLL_CY | ASSCDEG_CY | BACHDEG_CY | |
|---|---|---|---|---|---|---|---|---|---|---|---|---|---|---|---|---|---|---|---|---|---|
| 0 | 2005 | 33 | 063 | 0.1 | -121.005833 | 40.036944 | 2 | 2 | 0 | 19292 | ... | 45275 | 66596 | 14802 | 447 | 909 | 3153 | 415 | 4803 | 1672 | 2048 |
| 1 | 2005 | 153 | 063 | 2.3 | -120.451111 | 39.817222 | 6 | 3 | 0 | 19292 | ... | 45275 | 66596 | 14802 | 447 | 909 | 3153 | 415 | 4803 | 1672 | 2048 |
| 2 | 2005 | 234 | 063 | 0.5 | -121.147500 | 39.872222 | 8 | 0 | 0 | 19292 | ... | 45275 | 66596 | 14802 | 447 | 909 | 3153 | 415 | 4803 | 1672 | 2048 |
| 3 | 2005 | 241 | 063 | 0.1 | -120.903889 | 39.962222 | 8 | 0 | 0 | 19292 | ... | 45275 | 66596 | 14802 | 447 | 909 | 3153 | 415 | 4803 | 1672 | 2048 |
| 4 | 2005 | 242 | 063 | 1.0 | -120.706667 | 40.056944 | 8 | 1 | 0 | 19292 | ... | 45275 | 66596 | 14802 | 447 | 909 | 3153 | 415 | 4803 | 1672 | 2048 |
5 rows × 29 columns
m = gis.map('California')
m
lyr = gis.content.import_data(enrich_df, title='Demographic Profile')m.add_layer(lyr, {'renderer':'ClassedColorRenderer', 'field':'AVGHINC_CY'})Fit Random Forest classifier and check accuracy
X = mdf.drop(['ARSON'], axis=1).values
y = mdf['ARSON'].values
X_train, X_test, y_train, y_test = train_test_split(X,y,test_size=0.3, random_state=42)

clf_rf = ske.RandomForestClassifier(n_estimators=200)
clf_rf = clf_rf.fit(X_train, y_train)

print(clf_rf.score(X_test, y_test))
0.9212070907689571
Summary: Given some basic data, available when a fire is first discovered, it is possible to predict with over 90% accuracy if the fire was the result of arson.
Citations
Short, Karen C. 2017. Spatial wildfire occurrence data for the United States, 1992-2015 [FPA_FOD_20170508]. 4th Edition. Fort Collins, CO: Forest Service Research Data Archive. https://doi.org/10.2737/RDS-2013-0009.4