Display a web map with a point feature layer that has feature reduction enabled to aggregate points into clusters.
Use case
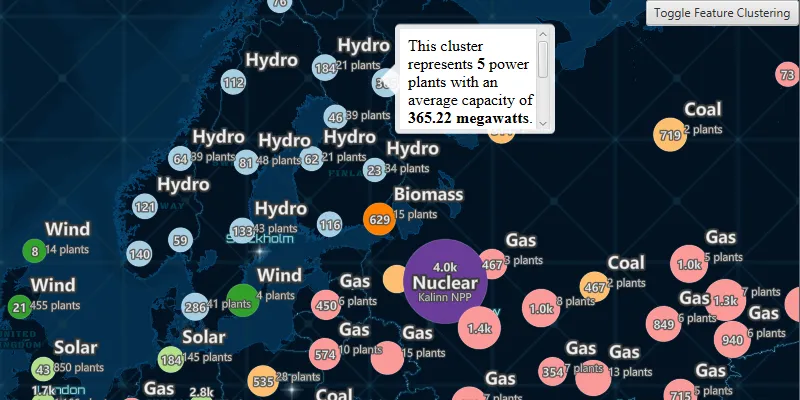
Feature clustering can be used to dynamically aggregate groups of points that are within proximity of each other in order to represent each group with a single symbol. Such grouping allows you to see patterns in the data that are difficult to visualize when a layer contains hundreds or thousands of points that overlap and cover each other.
How to use the sample
Pan and zoom the map to view how clustering is dynamically updated. Toggle clustering off to view the original point features that make up the clustered elements. When clustering is On, you can click on a clustered geoelement to view aggregated information and summary statistics for that cluster. When clustering is toggled off and you click on the original feature you get access to information about individual power plant features.
How it works
- Create a map from a web map
PortalItem. - Get the cluster enabled layer from the map’s operational layers.
- Get the
FeatureReductionfrom the feature layer and callsetEnabled(boolean enabled)to enable or disable clustering on the feature layer. - When the user clicks on the map, call
identifyLayerAsyncon the feature layer and pass in the map click location. - Get the
Popupfrom the resultingIdentifyLayerResult. - Get the popup’s
getDescriptionand using aWebViewinside aVBox, display it by setting the callout’ssetCustomView.
Relevant API
- AggregateGeoElement
- FeatureLayer
- FeatureReduction
- GeoElement
- IdentifyLayerResult
About the data
This sample uses a web map that displays the Esri Global Power Plants feature layer with feature reduction enabled. When enabled, the aggregate features symbology shows the color of the most common power plant type, and a size relative to the average plant capacity of the cluster.
Tags
aggregate, bin, cluster, group, merge, normalize, reduce, summarize
Sample code
/* * Copyright 2024 Esri. * * Licensed under the Apache License, Version 2.0 (the "License"); you may not * use this file except in compliance with the License. You may obtain a copy of * the License at * * http://www.apache.org/licenses/LICENSE-2.0 * * Unless required by applicable law or agreed to in writing, software * distributed under the License is distributed on an "AS IS" BASIS, WITHOUT * WARRANTIES OR CONDITIONS OF ANY KIND, either express or implied. See the * License for the specific language governing permissions and limitations under * the License. */
package com.esri.samples.display_clusters;
import java.util.concurrent.ExecutionException;import java.util.concurrent.TimeUnit;import java.util.concurrent.TimeoutException;import com.esri.arcgisruntime.ArcGISRuntimeEnvironment;import com.esri.arcgisruntime.concurrent.ListenableFuture;import com.esri.arcgisruntime.geometry.Point;import com.esri.arcgisruntime.layers.FeatureLayer;import com.esri.arcgisruntime.loadable.LoadStatus;import com.esri.arcgisruntime.mapping.ArcGISMap;import com.esri.arcgisruntime.mapping.popup.Popup;import com.esri.arcgisruntime.mapping.view.Callout;import com.esri.arcgisruntime.mapping.view.IdentifyLayerResult;import com.esri.arcgisruntime.mapping.view.MapView;import com.esri.arcgisruntime.portal.Portal;import com.esri.arcgisruntime.portal.PortalItem;import javafx.application.Application;import javafx.geometry.Point2D;import javafx.geometry.Pos;import javafx.scene.Scene;import javafx.scene.control.ToggleButton;import javafx.scene.layout.Pane;import javafx.scene.web.WebEngine;import javafx.scene.web.WebView;import javafx.scene.layout.StackPane;import javafx.stage.Stage;
public class DisplayClustersSample extends Application {
  private ArcGISMap map;  private MapView mapView;  private PortalItem portalItem; // keep loadable in scope to avoid garbage collection  private FeatureLayer powerPlantsLayer;  private Callout callout;  private WebEngine webEngine;
  @Override  public void start(Stage stage) {
    try {      // create stack pane and application scene      StackPane stackPane = new StackPane();      Scene scene = new Scene(stackPane);
      // set title, size, and add scene to stage      stage.setTitle("Display Clusters Sample");      stage.setWidth(800);      stage.setHeight(700);      stage.setScene(scene);      stage.show();
      // authentication with an API key or named user is required to access basemaps and other location services      String yourAPIKey = System.getProperty("apiKey");      ArcGISRuntimeEnvironment.setApiKey(yourAPIKey);
      // create a button to toggle clustering      ToggleButton featureClusteringToggle = new ToggleButton("Toggle Feature Clustering");      featureClusteringToggle.setDisable(true);      // The cluster layer is enabled by default, so let's also set the togglebutton toggled      featureClusteringToggle.setSelected(true);
      // create a portal and portal item, using the portal and item ID      var portal = new Portal("https://www.arcgis.com/");      portalItem = new PortalItem(portal, "8916d50c44c746c1aafae001552bad23");
      map = new ArcGISMap(portalItem);      map.addDoneLoadingListener(() -> {        if (map.getLoadStatus() == LoadStatus.LOADED) {          featureClusteringToggle.setDisable(false);
          powerPlantsLayer = (FeatureLayer)map.getOperationalLayers().get(0);
          WebView webView = new WebView();          webView.setMaxHeight(200);          webView.setMaxWidth(150);          Pane region = new Pane();          callout = mapView.getCallout();          callout.setCustomView(region);          webEngine = webView.getEngine();          region.getChildren().add(webView);
          // when the button is clicked, toggle the feature clustering          mapView.setOnMouseClicked(mouseEvent -> {            if (mapView == null) {              return;            }
            mapView.getCallout().dismiss();            Point2D point = new Point2D(mouseEvent.getX(), mouseEvent.getY());            ListenableFuture<IdentifyLayerResult> identifiedLayerResultsFuture = mapView.identifyLayerAsync(powerPlantsLayer, point, 3.0, false);            identifiedLayerResultsFuture.addDoneListener(() -> {              IdentifyLayerResult identifiedLayerResults = null;              try {                identifiedLayerResults = identifiedLayerResultsFuture.get(10, TimeUnit.SECONDS);                if (identifiedLayerResults == null || identifiedLayerResults.getPopups().isEmpty()) {                  return;                }
                Popup popup = identifiedLayerResults.getPopups().get(0);
                String htmlText = popup.getDescription();
                webEngine.loadContent(htmlText);
                callout.screenToLocal(point);                // show the callout where the user clicked                Point mapPoint = mapView.screenToLocation(point);                callout.showCalloutAt(mapPoint);
              } catch (TimeoutException | ExecutionException | InterruptedException e) {                throw new RuntimeException(e);              }            });          });
          featureClusteringToggle.setOnAction(event -> {            powerPlantsLayer.getFeatureReduction().setEnabled(!powerPlantsLayer.getFeatureReduction().isEnabled());            mapView.getCallout().dismiss();          });        }      });
      // create a map view and set the map to it      mapView = new MapView();      mapView.setMap(map);
      // add the map view, button, and progress bar to stack pane      stackPane.getChildren().addAll(mapView, featureClusteringToggle);      StackPane.setAlignment(featureClusteringToggle, Pos.TOP_RIGHT);
    } catch (Exception e) {      // on any error, display the stack trace.      e.printStackTrace();    }  }
  /**   * Stops and releases all resources used in application.   */  @Override  public void stop() {
    if (mapView != null) {      mapView.dispose();    }  }
  /**   * Opens and runs application.   *   * @param args arguments passed to this application   */  public static void main(String[] args) {
    Application.launch(args);  }
}