Query a feature table for statistics, grouping and sorting by different fields.
Use case
You can use statistical queries, grouping and sorting to process large amounts of data saved in feature tables. This is helpful for identifying trends and relationships within the data, which can be used to support further interpretations and decisions. For example, a health agency can use information on medical conditions occurring throughout a country to identify at-risk areas or demographics, and decide on further action and preventive measures.
How to use the sample
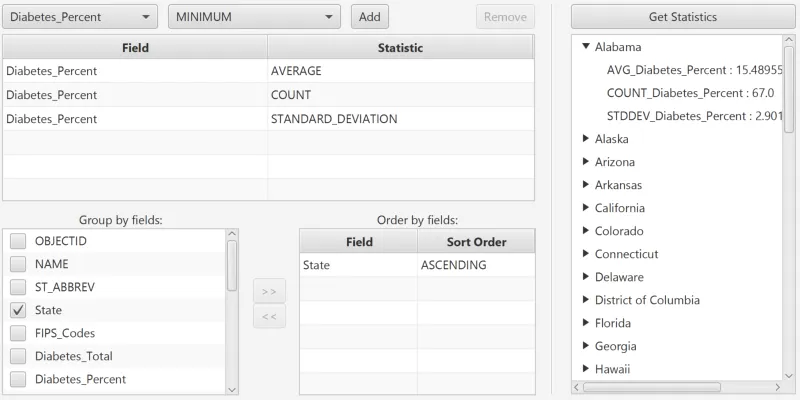
The sample will start with some default options selected. You can immediately click the “Get Statistics” button to see the results for these options. There are several ways to customize your queries:
-
You can add statistic definitions to the top-left table using the combo boxes and “Add” button. Select a table row and click “Remove” to remove a definition.
-
To change the Group-by fields, check the box by the field you want to group by in the bottom-left list view.
-
To change the Order-by fields, select a Group-by field (it must be checked) and click the ”>>” button to add it to the Order-by table. To remove a field from the Order-by table, select it and click the ”<<” button. To change the sort order of the Order-by field, the cells of the “Sort Order” column are combo-boxes that may be either ASCENDING or DESCENDING.
How it works
- Create a
ServiceFeatureTableusing the URL of a feature service and load the table. - Get the feature tables field names list with
featureTable.getFields(). - Create
StatisticDefinitions specifying the field to compute statistics on and theStatisticTypeto compute. - Create
StatisticsQueryParameterspassing in the list of statistic definitions. - To have the results grouped by fields, add the field names to the query parameters’
groupByFieldNamescollection. - To have the results ordered by fields, create
OrderBys, specifying the field name andSortOrder. Pass theseOrderBys to the parameters’orderByFieldscollection. - To execute the query, call
featureTable.queryStatisticsAsync(queryParameters). - Get the
StatisticQueryResult. From this, you can get an iterator ofStatisticRecords to loop through and display.
About the data
This sample uses a Diabetes, Obesity, and Inactivity by US County feature layer hosted on ArcGIS Online.
Relevant API
- Field
- QueryParameters.OrderBy
- QueryParameters
- ServiceFeatureTable
- StatisticDefinition
- StatisticRecord
- StatisticsQueryParameters
- StatisticsQueryResult
- StatisticType
Tags
correlation, data, fields, filter, group, sort, statistics, table
Sample code
package com.esri.samples.statistical_query_group_and_sort;
import javafx.beans.property.SimpleBooleanProperty;import javafx.beans.property.SimpleStringProperty;
/** * Convenience bean class for representing a group-by field. The grouping property can be bound to a CheckBoxListCell * to choose whether the field should be grouped by with a CheckBox. */class GroupField {
  private final SimpleStringProperty fieldName;  private final SimpleBooleanProperty grouping;
  GroupField(String fieldName, Boolean grouping) {    this.fieldName = new SimpleStringProperty(fieldName);    this.grouping = new SimpleBooleanProperty(grouping);  }
  String getFieldName() {    return fieldName.get();  }
  public SimpleStringProperty fieldNameProperty() {    return fieldName;  }
  public void setFieldName(String fieldName) {    this.fieldName.set(fieldName);  }
  boolean isGrouping() {    return grouping.get();  }
  SimpleBooleanProperty groupingProperty() {    return grouping;  }
  void setGrouping(boolean grouping) {    this.grouping.set(grouping);  }
  @Override  public String toString() {    return getFieldName();  }}
package com.esri.samples.statistical_query_group_and_sort;
import javafx.beans.binding.Bindings;import javafx.beans.property.SimpleObjectProperty;import javafx.beans.property.SimpleStringProperty;
import com.esri.arcgisruntime.data.QueryParameters;
/** * Convenience bean class for representing OrderBy in a TableView row. The sortOrder property can be bound to a * ComboBoxTableCell for changing the sortOrder with a ComboBox. */class OrderByField {
private final SimpleStringProperty fieldName; private final SimpleObjectProperty<QueryParameters.SortOrder> sortOrder; private final SimpleObjectProperty<QueryParameters.OrderBy> orderBy;
OrderByField(QueryParameters.OrderBy orderBy) { this.fieldName = new SimpleStringProperty(orderBy.getFieldName()); this.sortOrder = new SimpleObjectProperty<>(orderBy.getSortOrder()); this.orderBy = new SimpleObjectProperty<>(); this.orderBy.bind(Bindings.createObjectBinding(() -> new QueryParameters.OrderBy(this.fieldName.get(), this .sortOrder.get()), this.fieldName, this.sortOrder)); }
String getFieldName() { return fieldName.get(); }
SimpleStringProperty fieldNameProperty() { return fieldName; }
public void setFieldName(String fieldName) { this.fieldName.set(fieldName); }
public QueryParameters.SortOrder getSortOrder() { return sortOrder.get(); }
SimpleObjectProperty<QueryParameters.SortOrder> sortOrderProperty() { return sortOrder; }
public void setSortOrder(QueryParameters.SortOrder sortOrder) { this.sortOrder.set(sortOrder); }
QueryParameters.OrderBy getOrderBy() { return orderBy.get(); }
public SimpleObjectProperty<QueryParameters.OrderBy> orderByProperty() { return orderBy; }
public void setOrderBy(QueryParameters.OrderBy orderBy) { this.orderBy.set(orderBy); }}package com.esri.samples.statistical_query_group_and_sort;
import java.util.Arrays;import java.util.Iterator;import java.util.List;import java.util.stream.Collectors;
import javafx.fxml.FXML;import javafx.scene.control.Alert;import javafx.scene.control.Button;import javafx.scene.control.ComboBox;import javafx.scene.control.ListView;import javafx.scene.control.TableColumn;import javafx.scene.control.TablePosition;import javafx.scene.control.TableView;import javafx.scene.control.TreeItem;import javafx.scene.control.TreeView;import javafx.scene.control.cell.CheckBoxListCell;import javafx.scene.control.cell.ComboBoxTableCell;import javafx.scene.control.cell.PropertyValueFactory;
import com.esri.arcgisruntime.concurrent.ListenableFuture;import com.esri.arcgisruntime.data.Field;import com.esri.arcgisruntime.data.QueryParameters;import com.esri.arcgisruntime.data.ServiceFeatureTable;import com.esri.arcgisruntime.data.StatisticDefinition;import com.esri.arcgisruntime.data.StatisticRecord;import com.esri.arcgisruntime.data.StatisticType;import com.esri.arcgisruntime.data.StatisticsQueryParameters;import com.esri.arcgisruntime.data.StatisticsQueryResult;import com.esri.arcgisruntime.loadable.LoadStatus;
public class StatisticalQueryGroupAndSortController {
@FXML private ComboBox<String> fieldNameComboBox; @FXML private ComboBox<String> statisticTypeComboBox; @FXML private TableView<StatisticDefinition> statisticDefinitionsTableView; @FXML private TreeView<String> statisticRecordTreeView; @FXML private ListView<GroupField> groupFieldsListView; @FXML private TableColumn<StatisticDefinition, String> statisticDefinitionFieldNameTableColumn; @FXML private TableColumn<StatisticDefinition, StatisticType> statisticDefinitionStatisticTypeTableColumn; @FXML private Button removeStatisticDefinitionButton; @FXML private TableView<OrderByField> orderByTableView; @FXML private TableColumn<OrderByField, String> orderByFieldNameTableColumn; @FXML private TableColumn<OrderByField, QueryParameters.SortOrder> orderBySortOrderTableColumn; @FXML private Button addOrderByFieldButton; @FXML private Button removeOrderByFieldButton;
private ServiceFeatureTable featureTable;
public void initialize() {
setUpButtonBindings(); initializeStatisticDefinitionsTableView(); initializeGroupByListView(); initializeOrderByTableView();
// load the service feature table String USStatesServiceUri = "https://services.arcgis.com/jIL9msH9OI208GCb/arcgis/rest/services/Counties_Obesity_Inactivity_Diabetes_2013/FeatureServer/0"; featureTable = new ServiceFeatureTable(USStatesServiceUri); featureTable.loadAsync(); featureTable.addDoneLoadingListener(() -> { if (featureTable.getLoadStatus() == LoadStatus.LOADED) { // populate the field name combo box with the feature table's field names List<String> fieldNames = featureTable.getFields().stream().map(Field::getName).collect(Collectors.toList()); fieldNameComboBox.getItems().addAll(fieldNames);
// populate the statistic type combo box with the different StatisticType values statisticTypeComboBox.getItems().addAll(Arrays.stream(StatisticType.values()).map(Enum::toString).collect(Collectors.toList()));
// populate the Group By list with all of the field names with none of the check boxes selected groupFieldsListView.getItems().addAll(fieldNames.stream().map(f -> new GroupField(f, false)).collect (Collectors.toList()));
// set some default selections fieldNameComboBox.getSelectionModel().select("Diabetes_Percent"); statisticTypeComboBox.getSelectionModel().select("MINIMUM"); statisticDefinitionsTableView.getItems().addAll( new StatisticDefinition("Diabetes_Percent", StatisticType.AVERAGE), new StatisticDefinition("Diabetes_Percent", StatisticType.COUNT), new StatisticDefinition("Diabetes_Percent", StatisticType.STANDARD_DEVIATION) ); groupFieldsListView.getItems().stream().filter(f -> f.getFieldName().equals("State")).collect(Collectors .toList()).get(0).setGrouping(true); orderByTableView.getItems().add(new OrderByField(new QueryParameters.OrderBy("State", QueryParameters.SortOrder .ASCENDING))); } else { new Alert(Alert.AlertType.ERROR, "Failed to load feature table").show(); } }); }
/** * Add a CheckBox to each Group By field which sets whether that field should be grouped by. */ private void initializeGroupByListView() { groupFieldsListView.setCellFactory(CheckBoxListCell.forListView(groupField -> { // if the user deselects a field to be grouped by, remove it from order-by table too groupField.groupingProperty().addListener((observable, wasGrouping, isNowGrouping) -> { List<OrderByField> orderByFieldsMatchingGroupByField = orderByTableView.getItems().stream().filter(row -> row .getFieldName().equals(groupField.getFieldName())).collect(Collectors.toList()); if (!isNowGrouping && !orderByFieldsMatchingGroupByField.isEmpty()) { orderByTableView.getItems().removeAll(orderByFieldsMatchingGroupByField); } }); // bind the checkbox selection to the grouping property return groupField.groupingProperty(); })); }
/** * Initializes the Statistics Definition table view. Configures the columns to show the correct field values. */ private void initializeStatisticDefinitionsTableView() { // make the table columns stretch to fill the width of the table statisticDefinitionsTableView.setColumnResizePolicy(TableView.CONSTRAINED_RESIZE_POLICY);
// show the field name and statistic type values in the column cells statisticDefinitionFieldNameTableColumn.setCellValueFactory(new PropertyValueFactory<>("fieldName")); statisticDefinitionStatisticTypeTableColumn.setCellValueFactory(new PropertyValueFactory<>("statisticType")); }
/** * Initializes the Order By table view. Configures the table columns to show the correct field values and allow the * sort order of each field to be changed with a ComboBox. */ private void initializeOrderByTableView() { // make the table columns stretch to fill the width of the table orderByTableView.setColumnResizePolicy(TableView.CONSTRAINED_RESIZE_POLICY);
// show the field name and sort order values in the column cells orderByFieldNameTableColumn.setCellValueFactory(cellData -> cellData.getValue().fieldNameProperty()); orderBySortOrderTableColumn.setCellValueFactory(cellData -> cellData.getValue().sortOrderProperty());
// show an editable ComboBox in the sort order column cells to change the sort order orderBySortOrderTableColumn.setCellFactory(col -> { ComboBoxTableCell<OrderByField, QueryParameters.SortOrder> ct = new ComboBoxTableCell<>(); ct.getItems().addAll(QueryParameters.SortOrder.values()); ct.setEditable(true); return ct; });
// switch to edit mode when the user selects the Sort Order column orderByTableView.getSelectionModel().selectedItemProperty().addListener(e -> { List<TablePosition> tablePositions = orderByTableView.getSelectionModel().getSelectedCells(); if (!tablePositions.isEmpty()) { tablePositions.forEach(tp -> orderByTableView.edit(tp.getRow(), orderBySortOrderTableColumn)); } }); }
/** * Sets up button bindings. */ private void setUpButtonBindings() { // disable the "Remove" button when no statistic definitions are selected removeStatisticDefinitionButton.disableProperty().bind(statisticDefinitionsTableView.getSelectionModel() .selectedItemProperty().isNull()); // disable the ">>" button when no Group By fields are selected addOrderByFieldButton.disableProperty().bind(groupFieldsListView.getSelectionModel().selectedItemProperty().isNull()); // disable the "<<" button when no Order By fields are selected removeOrderByFieldButton.disableProperty().bind(orderByTableView.getSelectionModel().selectedItemProperty().isNull()); }
/** * Called when the "Add" button is clicked. Adds a statistic definition to the table. */ @FXML private void addSelectedStatisticDefinition() { // get the selected field and statistic from the combo boxes String selectedFieldName = fieldNameComboBox.getSelectionModel().getSelectedItem(); String selectedStatisticType = statisticTypeComboBox.getSelectionModel().getSelectedItem(); // check that a statistic definition with that field and statistic type is not already in the table if (statisticDefinitionsTableView.getItems().stream().filter(row -> row.getFieldName().equals(selectedFieldName) && row .getStatisticType().name().equals(selectedStatisticType)).collect(Collectors.toList()).isEmpty()) { // add the statistic definition to the table statisticDefinitionsTableView.getItems().add(new StatisticDefinition(selectedFieldName, StatisticType.valueOf(selectedStatisticType))); } else { new Alert(Alert.AlertType.WARNING, "The selected combination has already been chosen.").show(); } }
/** * Called when the "Remove" button is clicked. Removes a statistic definition from the table. */ @FXML private void removeSelectedStatisticDefinition() { statisticDefinitionsTableView.getItems().removeAll(statisticDefinitionsTableView.getSelectionModel().getSelectedItems()); }
/** * Called when the ">>" button is clicked. Adds a Group By field to the Order By table. */ @FXML private void addSelectedOrderByField() { // get the selected field in the Group By list GroupField selectedGroupField = groupFieldsListView.getSelectionModel().getSelectedItem(); // check that the selected field is grouped by and not already in the Order By table if (!selectedGroupField.isGrouping()) { new Alert(Alert.AlertType.WARNING, "Only group fields can be ordered. You must check the selected group item's " + "checkbox before adding the field to the ordered list.").show(); } else if (!orderByTableView.getItems().stream().filter(row -> row.getFieldName().equals(selectedGroupField .getFieldName())).collect(Collectors.toList()).isEmpty()) { new Alert(Alert.AlertType.WARNING, "The field has already been added.").show(); } else { // add the field to the Order By table, defaulting to ascending sort order orderByTableView.getItems().add(new OrderByField(new QueryParameters.OrderBy(selectedGroupField.getFieldName(), QueryParameters.SortOrder.ASCENDING))); } }
/** * Called when the "<<" button is clicked. Removes a Order by field from the table. */ @FXML private void removeSelectedOrderByField() { OrderByField selectedOrderByField = orderByTableView.getSelectionModel().getSelectedItem(); if (selectedOrderByField != null) { orderByTableView.getItems().remove(selectedOrderByField); } }
/** * Called when the "Get Statistics" button is clicked. Executes the statistics query with all of the input parameters. */ @FXML private void getStatistics() { // sets the root if this is the first result set, or clears the results from the previous query statisticRecordTreeView.setRoot(new TreeItem<>(""));
// get the statistics definitions from the table, show an alert if there are none and return early List<StatisticDefinition> statisticDefinitions = statisticDefinitionsTableView.getItems(); if (statisticDefinitions.isEmpty()) { new Alert(Alert.AlertType.WARNING, "Please define at least one statistic for the query").show(); return; }
// create statistics query parameters with the definitions StatisticsQueryParameters queryParameters = new StatisticsQueryParameters(statisticDefinitions);
// add the selected fields from the Group By list into the parameters' group-by field names queryParameters.getGroupByFieldNames().addAll(groupFieldsListView.getItems().stream().filter(GroupField::isGrouping) .map(GroupField::getFieldName).collect(Collectors.toList()));
// add the fields from the Order By table into the parameters' order-by fields queryParameters.getOrderByFields().addAll(orderByTableView.getItems().stream().map(OrderByField::getOrderBy).collect(Collectors.toList()));
// ignore counties with missing data queryParameters.setWhereClause("\"State\" IS NOT NULL");
// execute the statistics query ListenableFuture<StatisticsQueryResult> statisticsQuery = featureTable.queryStatisticsAsync(queryParameters); statisticsQuery.addDoneListener(() -> { try { // get the query result StatisticsQueryResult result = statisticsQuery.get();
// iterate through the result records for (Iterator<StatisticRecord> records = result.iterator(); records.hasNext();) { StatisticRecord record = records.next();
// create a tree item representing the group list TreeItem<String> groupTreeItem = new TreeItem<>(String.join(", ", record.getGroup().values().stream().map (Object::toString).collect(Collectors.toList()))); statisticRecordTreeView.getRoot().getChildren().add(groupTreeItem);
// add child tree items for each record's statistics, showing the statistic name and value List<TreeItem<String>> statisticTreeItems = record.getStatistics().entrySet().stream().map(statistic -> new TreeItem<>(statistic.getKey() + " : " + statistic.getValue()) ).collect(Collectors.toList()); groupTreeItem.getChildren().addAll(statisticTreeItems); } } catch (Exception ex) { new Alert(Alert.AlertType.ERROR, ex.getCause().getMessage()).show(); } }); }
}package com.esri.samples.statistical_query_group_and_sort;
/* * Copyright 2018 Esri. * * Licensed under the Apache License, Version 2.0 (the "License"); you may not * use this file except in compliance with the License. You may obtain a copy of * the License at * * http://www.apache.org/licenses/LICENSE-2.0 * * Unless required by applicable law or agreed to in writing, software * distributed under the License is distributed on an "AS IS" BASIS, WITHOUT * WARRANTIES OR CONDITIONS OF ANY KIND, either express or implied. See the * License for the specific language governing permissions and limitations under * the License. */
import java.io.IOException;
import javafx.application.Application;import javafx.fxml.FXMLLoader;import javafx.scene.Parent;import javafx.scene.Scene;import javafx.stage.Stage;
public class StatisticalQueryGroupAndSortSample extends Application {
@Override public void start(Stage stage) throws IOException { // set up the scene FXMLLoader loader = new FXMLLoader(getClass().getResource("/statistical_query_group_and_sort/main.fxml")); Parent root = loader.load(); loader.getController(); Scene scene = new Scene(root);
// set up the stage stage.setTitle("Statistical Query Group And Sort Sample"); stage.setWidth(800); stage.setHeight(700); stage.setScene(scene); stage.show(); }
/** * Opens and runs application. * * @param args arguments passed to this application */ public static void main(String[] args) {
Application.launch(args); }}