In this workflow, you will learn how to create a feature layer in a feature service for your data, and then build an application to access and display the features.
Prerequisites
You need an account for ArcGIS Platform, ArcGIS Online, or ArcGIS Enterprise to create hosted data services. If you need an account, go to Get started.
Steps
Get the data
For this workflow, you will use the Santa Monica Parcels dataset.
-
In your web browser, go to the Santa Monica Parcels item.
-
Click the Download button to download the zip file locally. Do not unzip this file.
Create a feature layer
To create a feature layer in a feature service, you need to upload data into ArcGIS. You can use data management tools or scripting APIs.
Data management tools
Import the shapefile using a data management tool.
In your web browser, go to ArcGIS.com and sign in with your ArcGIS Developer account.
-
In the top navigation bar, click Content.
-
Click New item. To upload the Santa Monica Parcels shapefile, you can either:
- Drag and drop the file.
- Or, click Your device and navigate to the file path.
-
Select Add Santa Monica Parcels.zip to publish the file as a hosted feature layer.
-
In Fields, leave all fields at their default settings and click Next.
-
In Location settings, leave the default settings and click Next.
-
Set the following information in the item details pane:
- Title:
Santa Monica Parcels - Tags:
Santa MonicaParcels. - Summary:
Parcels in the Santa Monica Mountains.
- Title:
-
Click Next to create the new feature layer and feature service.
In your web browser, go to ArcGIS.com and sign in with your ArcGIS Online account.
-
In the top navigation bar, click Content.
-
Click New item. To upload the Santa Monica Parcels shapefile, you can either:
- Drag and drop the file.
- Or, click Your device and navigate to the file path.
-
Select Add Santa Monica Parcels.zip to publish the file as a hosted feature layer.
-
In Fields, leave all fields at their default settings and click Next.
-
In Location settings, leave the default settings and click Next.
-
Set the following information in the item details pane:
- Title:
Santa Monica Parcels - Tags:
Santa MonicaParcels. - Summary:
Parcels in the Santa Monica Mountains.
- Title:
-
Click Next to create the new feature layer and feature service.
In your web browser, go to your ArcGIS Enterprise portal website and sign in with your ArcGIS Enterprise account.
-
In the top navigation bar, click Content.
-
Click New item. To upload the Santa Monica Parcels shapefile, you can either:
- Drag and drop the file.
- Or, click Your device and navigate to the file path.
-
Select Add Santa Monica Parcels.zip to publish the file as a hosted feature layer.
-
In Fields, leave all fields at their default settings and click Next.
-
In Location settings, leave the default settings and click Next.
-
Set the following information in the item details pane:
- Title:
Santa Monica Parcels - Tags:
Santa MonicaParcels. - Summary:
Parcels in the Santa Monica Mountains.
- Title:
-
Click Next to create the new feature layer and feature service.
You can use ArcGIS Pro to import shapefile data.
- Unzip the Santa Monica parcels zip file.
- The zip file contains the Parcels_Public.shp file.
- Launch ArcGIS Pro.
- Create a new map project.
- A map with
World Topographic MapandWorld Hillshadebasemap layers will be created.
- In the Map ribbon, click on Add Data > Data and select Parcels_Public.shp file.
The Parcels_Public.shp file is added as a feature layer to the map.
Scripting APIs
You can also import the shapefile with the ArcGIS API for Python or ArcGIS REST JS. The general steps are as follows:
- Import the required libraries.
- Provide an access token.
- Create and publish a portal item.
- Handle the results.
# local path to shapefile zip file
input_file_path = str(
Path(__file__).parent / "Santa_Monica_Public_Parcels.zip"
)
# add the zip file as an item to portal
shp_item = portal.content.add(
{
"title": "Santa Monica Public Parcels",
"description": "Santa Monica public parcels",
"tags": "Santa, Monica, public, parcels",
"type": "Shapefile",
},
input_file_path,
)
# publish the item to create a hosted featurelayer
shp_service = shp_item.publish(None)
print(f"New item id : {shp_service.id, }, url: {shp_service.layers[0].url}") // publish parameters
// https://developers.arcgis.com/rest/users-groups-and-items/publish-item.htm#ESRI_SECTION1_1016F32E313240D38E8CF741BDBC0BE8
const publishParams = {
name: 'Santa Monica parcels',
maxRecordCount: 2000,
hasStaticData: true,
layerInfo: { capabilities: 'Query' },
};
// create item
const zipItem = await createItem({
authentication: auth,
item: {
title: 'Santa Monica parcels',
description: 'Santa Monica parcels',
tags: 'Santa, Monica, parcels',
type: 'Shapefile',
},
file: f,
});
// execute publish operation
const publishedService = await request(publishURL, {
authentication: auth,
params: {
itemid: zipItem.id,
filetype: 'shapefile',
publishParameters: publishParams,
},
});
// handle results
console.log('New service created: ');
publishedService.services.forEach((s) => {
console.log(`\tid: ${s.serviceItemId} \n\turl:${s.serviceurl}`);
});
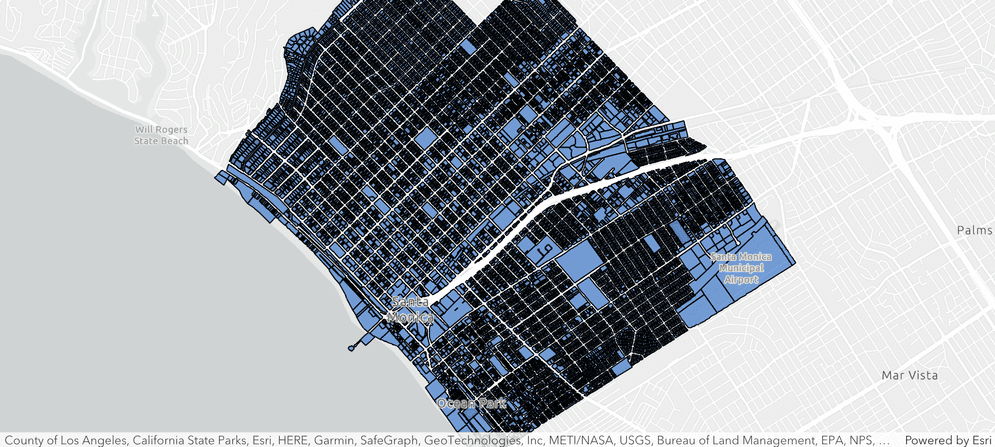
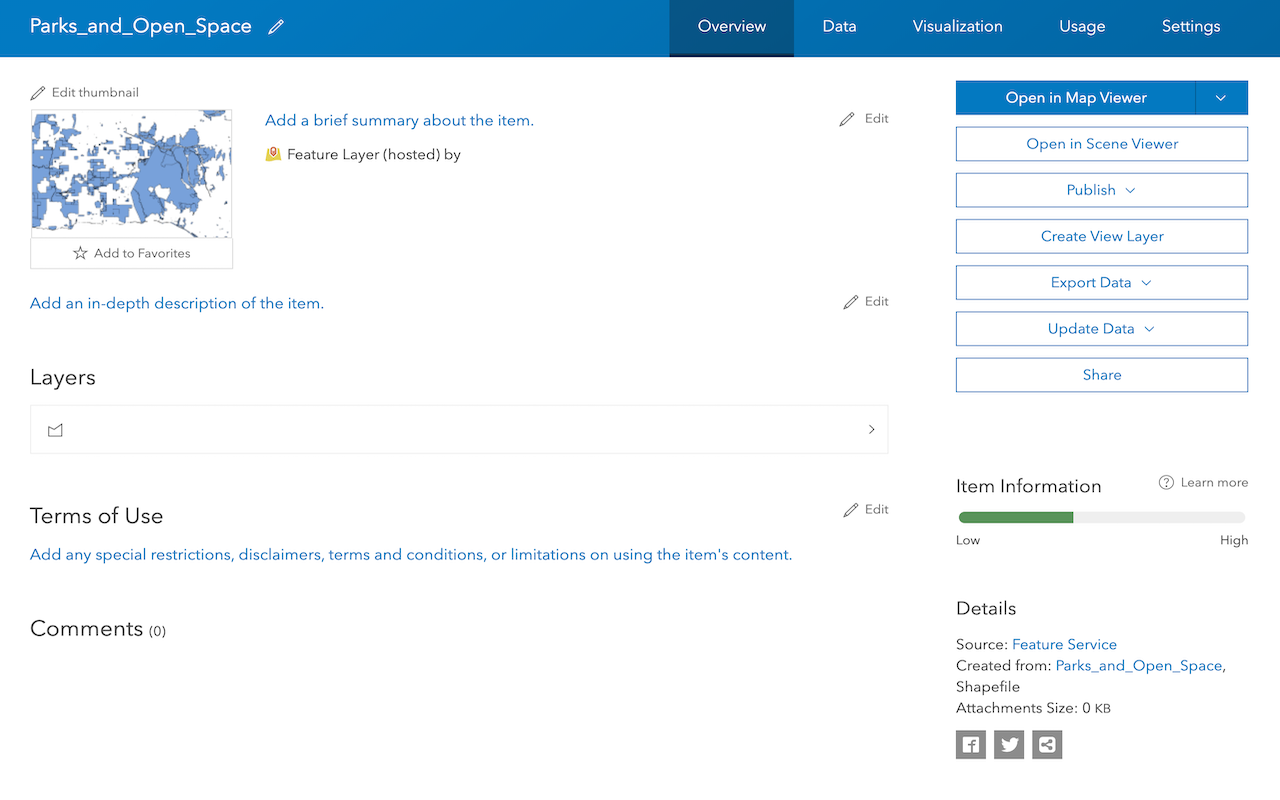
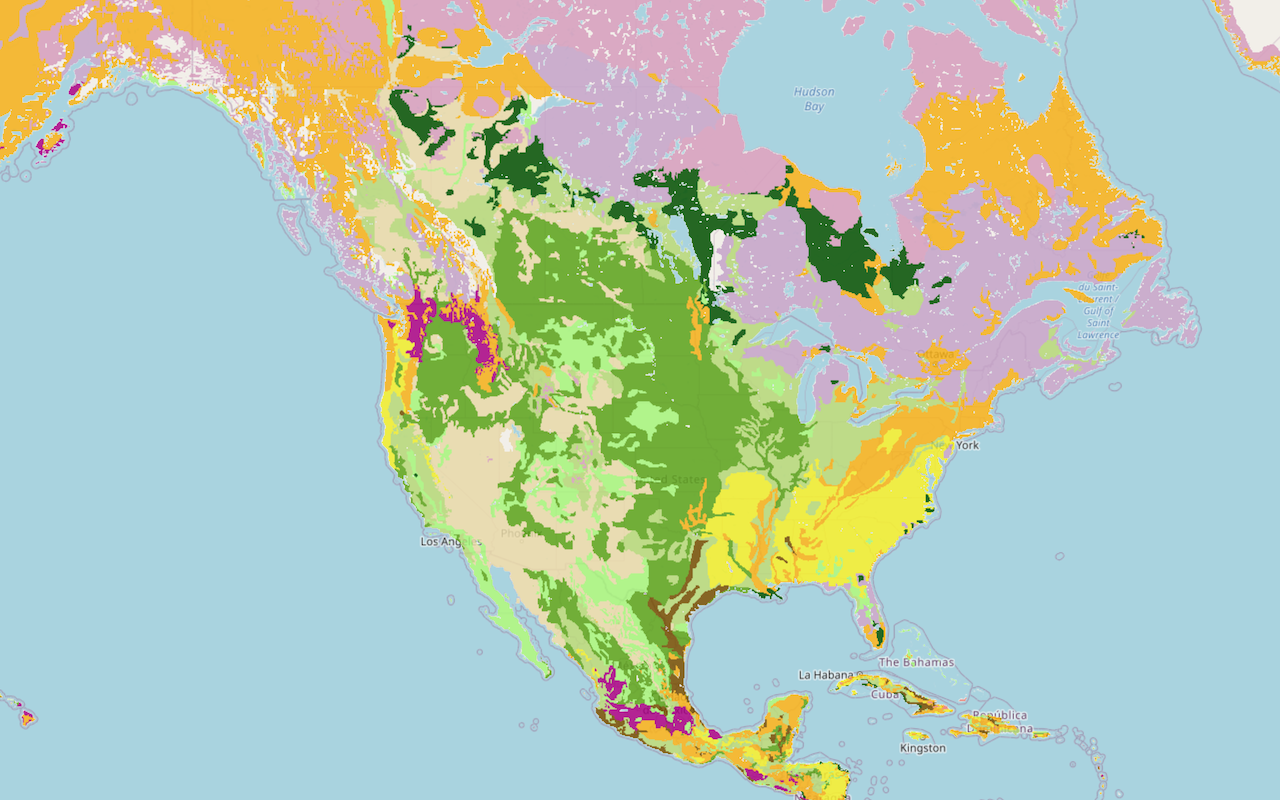
The feature layer will look something like this:
View the feature data
You can explore and edit the data fields and records for the feature layer using a data management tool.
In ArcGIS.com, use the Data tab in the item page to view the fields and records of the feature data.
-
In the item page > Data.
-
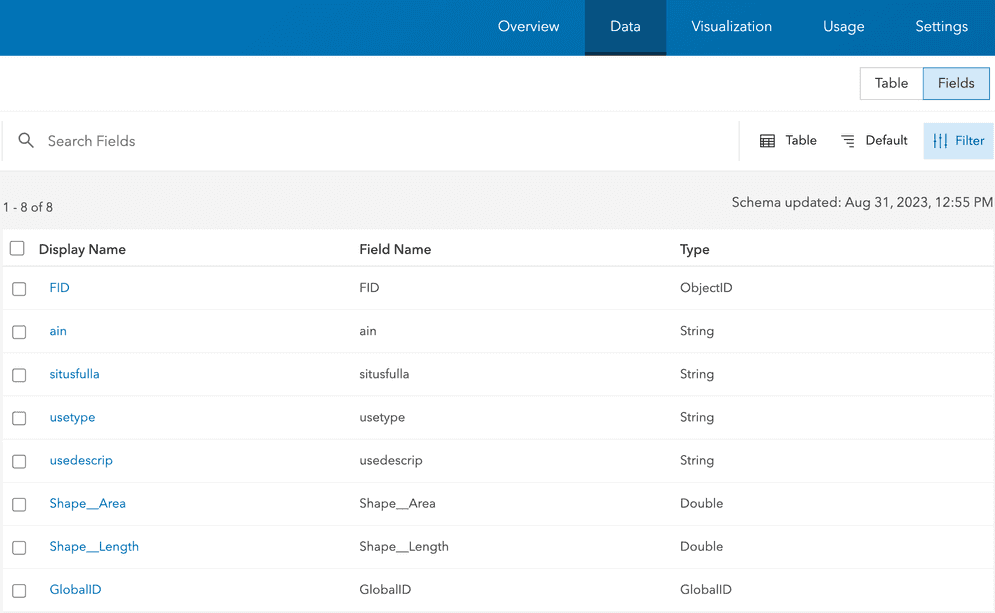
Note all the fields and associated records. There should be 23,531 features.
-
Click Fields to see all the fields in the dataset.
-
In Filters, click on a type to view the fields that contain Number or String records.
In ArcGIS.com, use the Data tab in the item page to view the fields and records of the feature data.
-
In the item page > Data.
-
Note all the fields and associated records. There should be 23,531 features.
-
Click Fields to see all the fields in the dataset.
-
In Filters, click on a type to view the fields that contain Number or String records.
In ArcGIS Enterprise portal, use the Data tab in the item pagel to view the fields and records of the feature data.
-
In the item page > Data.
-
Note all the fields and associated records. There should be 23,531 features.
-
Click Fields to see all the fields in the dataset.
-
In Filters, click on a type to view the fields that contain Number or String records.
You can use ArcGIS Pro to view the fields and records of the feature data.
-
Launch ArcGIS Pro
-
Create a new map project.
-
In the Catalog pane, click Project tab and add the shapefile to the map.
- The shapefile can be added by clicking and dragging onto the map or
- Right-click on the shapefile and click Add To Current Map.
-
In the Contents pane, right-click on the feature service and click Attribute Table. This will launch a table view.
- Note all the fields and associated records. There should be 23,531 features.
-
Click > Fields View to see all the fields in the dataset.

Set the feature styles
Use data management tools to set the style for a feature layer. Style the parcels based on the usetype field.
Use the Visualization tab in the item page in ArcGIS.com to style the Santa Monica parcels layer.
-
Go back to the item page page > Visualization.
-
In the left panel, click the Layers and select the Santa Monica parcels layer. In the right panel, click Styles.
-
Click + Field, and add
usetype. -
Under Pick a style, click Style options, update Types (unique symbols)
-
Click on the symbol next to each of the use type values to update the symbol color.
-
Set each of the
usetypevalues to the following properties:- Fill Color:
- Residental:
#ffde3e - Commercial:
#c29ed7 - Industrial:
#004c73 - Government:
#fc921f - Institutional:
#149ece - Recreational:
#267300 - Miscellaneous:
#b7814a
- Residental:

- Fill Color:
-
Click the X to exit out of Symbol style.
-
Click the pencil icon next to symbol style. Set the following properties for all the use types:
- Fill transparency:
30% - Outline color:
#ffffff - Outline transparency:
65% - Outline width:
1 - Adjust width automatically: false

- Fill transparency:
-
Click the X to exit out of Symbol style. Then click Done twice.
-
Click Save to save the style in the feature layer item.
Use the Visualization tab in the item page in ArcGIS.com to style the Santa Monica parcels layer.
-
Go back to the item page page > Visualization.
-
In the left panel, click the Layers and select the Santa Monica parcels layer. In the right panel, click Styles.
-
Click + Field, and add
usetype. -
Under Pick a style, click Style options, update Types (unique symbols)
-
Click on the symbol next to each of the use type values to update the symbol color.
-
Set each of the
usetypevalues to the following properties:- Fill Color:
- Residental:
#ffde3e - Commercial:
#c29ed7 - Industrial:
#004c73 - Government:
#fc921f - Institutional:
#149ece - Recreational:
#267300 - Miscellaneous:
#b7814a
- Residental:
- Fill Color:
-
Click the X to exit out of Symbol style.
-
Click the pencil icon next to symbol style. Set the following properties for all the use types:
- Fill transparency:
30% - Outline color:
#ffffff - Outline transparency:
65% - Outline width:
1 - Adjust width automatically: false
- Fill transparency:
-
Click the X to exit out of Symbol style. Then click Done twice.
-
Click Save to save the style in the feature layer item.
Use the Visualization tab in the item page in your ArcGIS Enterprise portal to style the Santa Monica parcels layer.
-
Go back to the item page page > Visualization.
-
In the left panel, click the Layers and select the Santa Monica parcels layer. In the right panel, click Styles.
-
Click + Field, and add
usetype. -
Under Pick a style, click Style options, update Types (unique symbols)
-
Click on the symbol next to each of the use type values to update the symbol color.
-
Set each of the
usetypevalues to the following properties:- Fill Color:
- Residental:
#ffde3e - Commercial:
#c29ed7 - Industrial:
#004c73 - Government:
#fc921f - Institutional:
#149ece - Recreational:
#267300 - Miscellaneous:
#b7814a
- Residental:
- Fill Color:
-
Click the X to exit out of Symbol style.
-
Click the pencil icon next to symbol style. Set the following properties for all the use types:
- Fill transparency:
30% - Outline color:
#ffffff - Outline transparency:
65% - Outline width:
1 - Adjust width automatically: false
- Fill transparency:
-
Click the X to exit out of Symbol style. Then click Done twice.
-
Click Save to save the style in the feature layer item.
You can use ArcGIS Pro to change the visualization of the Santa Monica parcels layer.
-
In the Content pane, right-click on the feature service and click Symbology.
-
In the Symbology pane, set the following properties:
- Primary symbology:
Unique values - Field 1:
useType
- Primary symbology:
-
In the Classes tab, click on the symbol for Commercial > Properties.
-
Set the fill colors for each
use:Type -
In the Appearance section, click the color button > Color Properties... to display the color palette. Set the following property:
- HEX#:
#c29ed7 - Transparency:
30%
- HEX#:
-
Repeat the above step for the following
use:Types - Fill Color:
- Residental:
#ffde3e - Industrial:
#004c73 - Government:
#fc921f - Institutional:
#149ece - Recreational:
#267300 - Miscellaneous:
#b7814a
- Residental:
- Fill Color:
-
-
Set the outline colors for each
use:Type - In the Appearance section, click the outline color button > Color Properties... to display the color palette. Set the following property for
Commercial:- HEX#:
#ffffff - Transparency:
65%
- HEX#:
- In the Appearance section, set the Outline width to
1.0 pt. - Repeat the above steps for each
use.Type
- In the Appearance section, click the outline color button > Color Properties... to display the color palette. Set the following property for
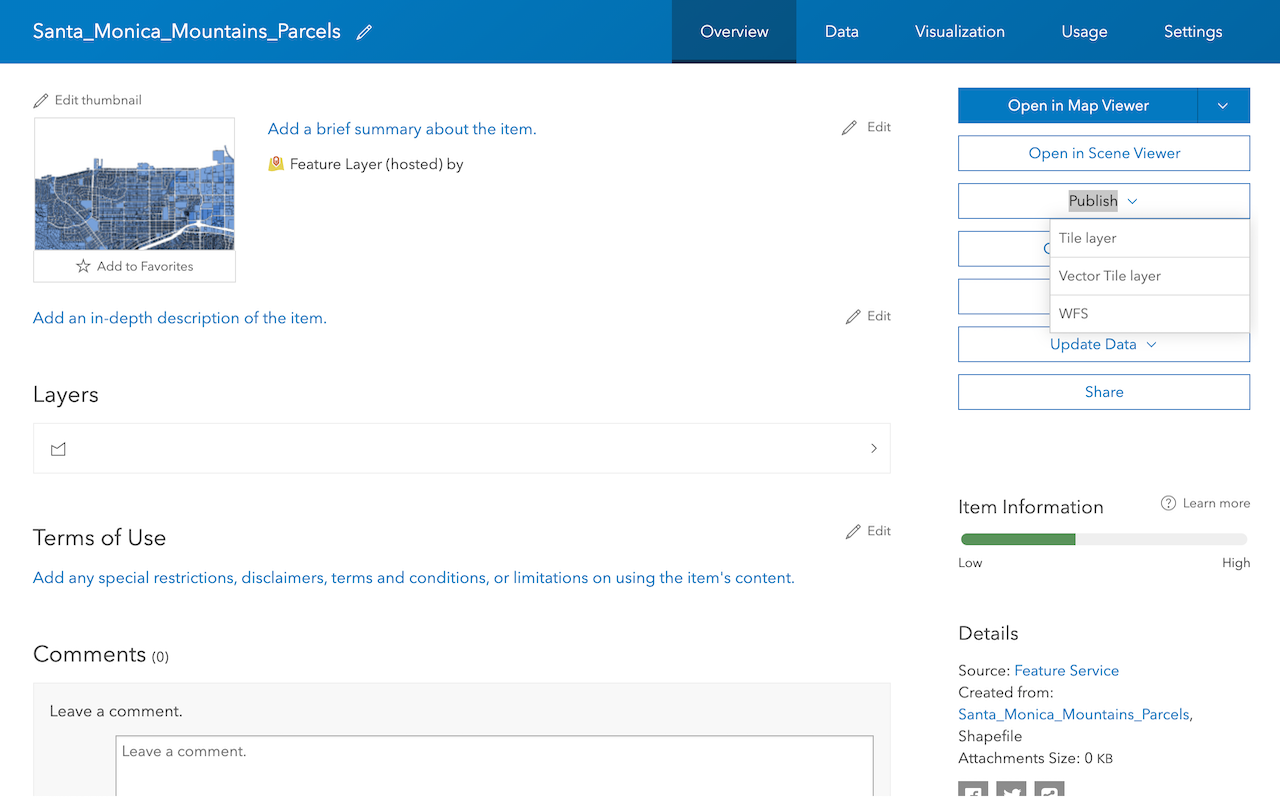
Publish as web layer
Before you can share the feature layer as a hosted feature layer, you will need to enable Allow assignment of unique numeric IDs for sharing web layers option. By default, this option is not enabled. Enabling this option will allow you to assign static IDs to feature layers in your project.
- In the Contents pane, right-click the Map > Properties
- In the General section, enable Allow assignment of unique numeric IDs for sharing web layers.
With that option enabled, you can now publish the Santa Monica Parcels polygon feature layer as a hosted feature layer.
- Right-click on feature layer and click Sharing > Share as Web Layer.
- The Share As Web Layer pane will be displayed.
- Set the following required information in the General tab:
- Name:
Santa Monica Parcels - Summary:
Parcels in the Santa Monica Mountains - Tags:
Santa Monica Parcels - Layer Type:
Feature - Set a location in your organization in Location
- Name:
- Click Analyze
- Any errors or warnings during the analyze process will be displayed in the Messages tab.
- Click Publish
A success message will be displayed with Manage the web layer link allowing you to visit the item page details of the hosted feature layer.
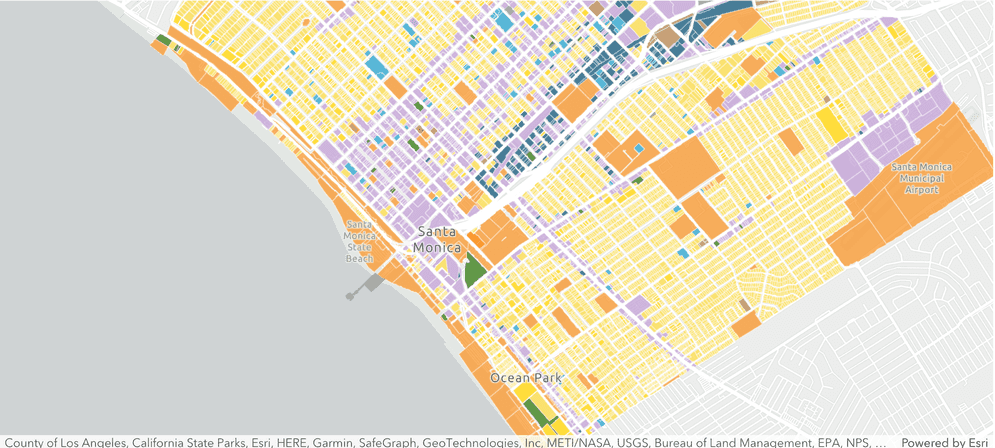
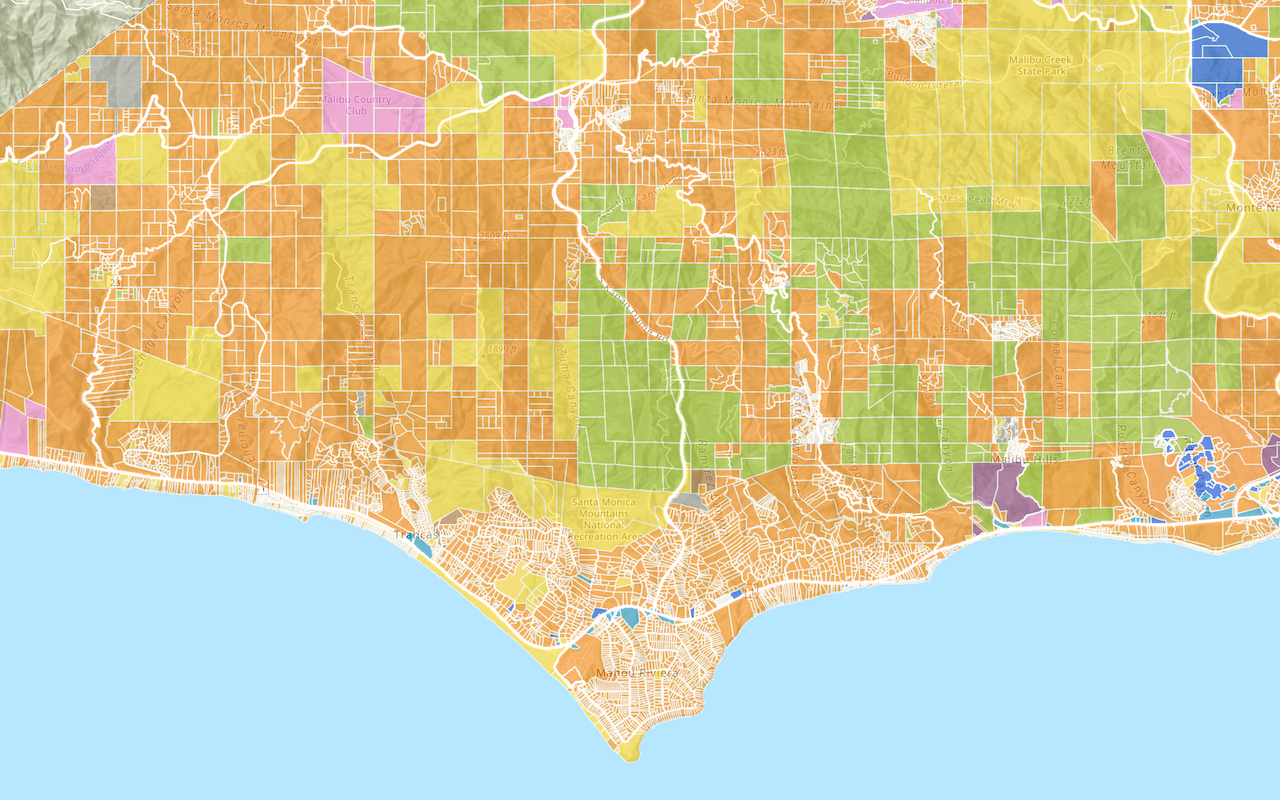
The styled layer will look something like this:
Manage service settings
The layer has a large amount of polygon features and vertices. For optimal performance and to conserve service resources, you should configure the service to support optimized layer drawing, spatial indexes, and longer CDN caching.
In ArcGIS.com, use the Settings tab to configure service settings such as cache and drawing optimization.
Enable the following settings:
-
Optimize layer drawing
- In the item page, go to the Settings > Optimize Layer Drawing. Click Optimize layers and select the layer to optimize > Update.
-
Cache control
- In the item page, go to the Settings tab > Cache control. Set the time you want users to wait before seeing updates to the layer.
In your ArcGIS Enterprise portal, use the Settings tab to configure service settings such as cache and drawing optimization.
Enable the following setting:
-
Optimize layer drawing
- In the item page, go to the Settings > Optimize Layer Drawing. Click Optimize layers and select the layer to optimize > Update.
Please see ArcGIS Platform, ArcGIS Online or ArcGIS Enterprise steps to manage service settings.
Get an access token
By default, the sharing level of an item is set to Owner and requires an access token, such as an API key to access it in a client-side application. If you have an ArcGIS Developer account, you can scope an API key to access private items. You cannot scope an API key to access private items if you have an ArcGIS Online or ArcGIS Enterprise account. Instead, to access private items, you need to generate a token from an OAuth 2.0 workflow.
-
Sign in to the developer dashboard.
-
Click the API keys tab > Edit API key.
-
In the Overview, find the Maps, layers, and data box. If you have an ArcGIS Developer account, you will be able to click Set content item scopes.
-
Select the item you want to scope > Add items.
-
Copy the API key.
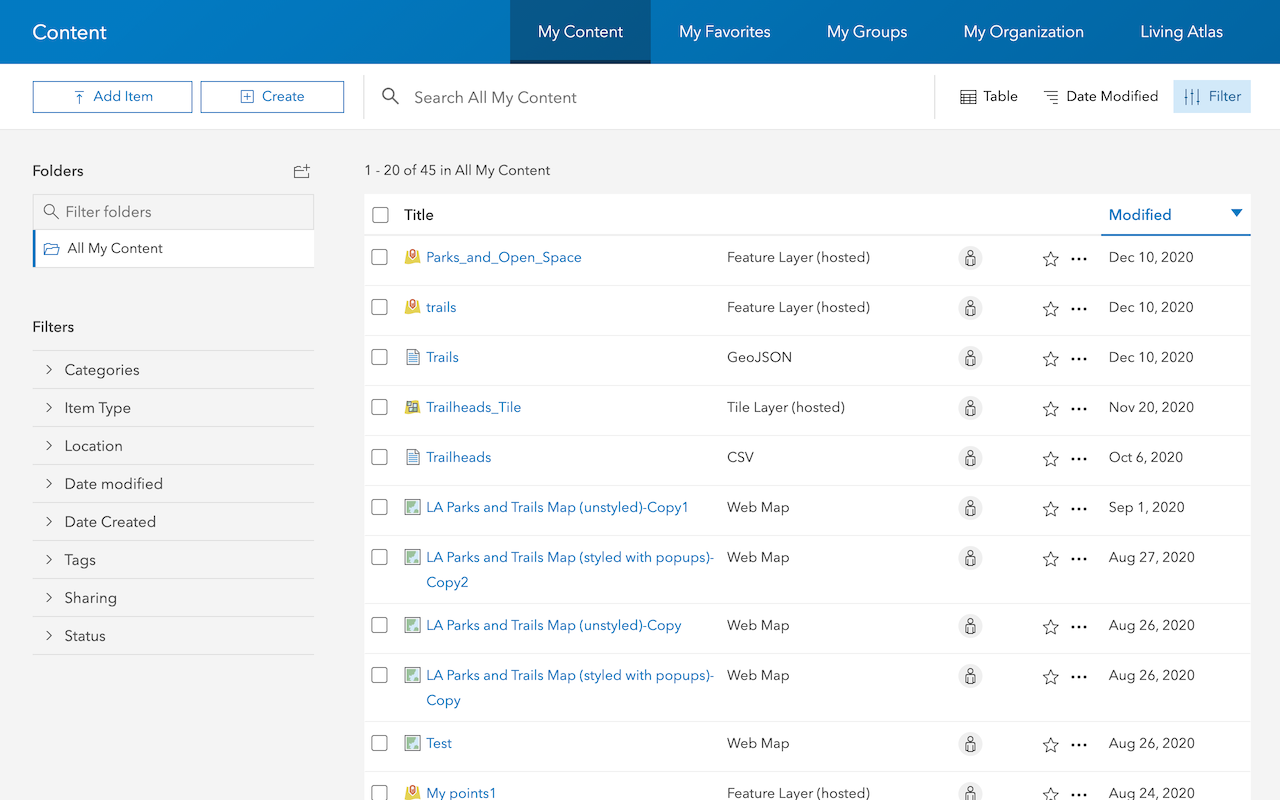
In your web browser, go to ArcGIS.com and sign in with your ArcGIS Online account.
- Click Content > My Content.
- Click the New Item > Application.
- Under Application Type, select Other application. Click Next.
- Fill out the following properties:
- Title:
Data hosting workflow - Application Id - Tags:
authentication,appid,data,hosting,workflow - Summary: AppId used to provide authentication for data hosting workflows
- Title:
- Click Save. Once saved, you will be redirected to the item page.
- Click the Overview tab.
- Under Credentials, Temporary Token click Copy to clipboard to copy the access token.
In your web browser, go to your ArcGIS Enterprise portal website and sign in with your ArcGIS Enterprise account.
- Click Content > My Content.
- Click the New Item > Application.
- Under Application Type, select Other application. Click Next.
- Fill out the following properties:
- Title:
Data hosting workflow - Application Id - Tags:
authentication,appid,data,hosting,workflow - Summary: AppId used to provide authentication for data hosting workflows
- Title:
- Click Save. Once saved, you will be redirected to the item page.
- Click the Overview tab.
- Under Credentials, Temporary Token click Copy to clipboard to copy the access token.
Please see ArcGIS Platform, ArcGIS Online or ArcGIS Enterprise steps to get an access token.
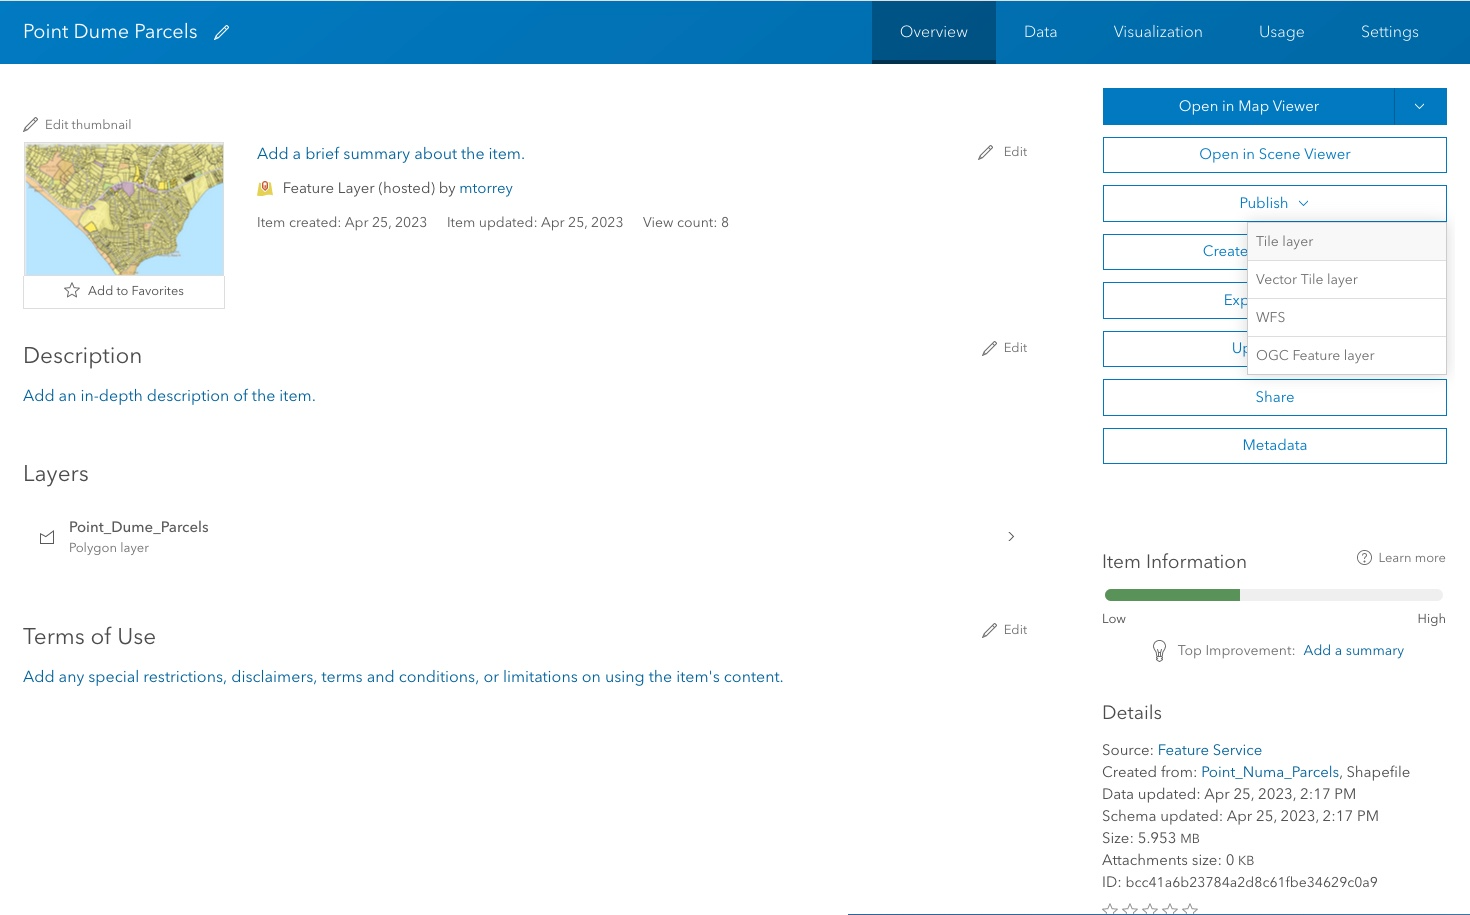
Find the service URL and item ID
To access a hosted layer from an application, you need to be able to identify its ID and URL. If a layer is public, you use the URL or item ID to access it directly with your web browser or any application. If the layer is private, you need to provide an access token.
If you are using ArcGIS Maps SDKs:
- In the item page, click View to access the feature service. Locate the Service ItemId, which will look something like this:
- Service ItemID: b5d71d19fd4b43fbb88abf07773ec0c7
If you are using open source libraries:
- In the item page, scroll down to the bottom of the page to find the Service URL. For example:
- Service URL:
hhttps://services3.arcgis.com/GVgb Jbqm8h XASVYi/arcgis/rest/services/Santa_ Monica_ public_ parcels/Feature Server
- Service URL:
-
In the item page, scroll down to the bottom of the page to find the Service URL. For example:
- Service URL:
https://{host}/{webadaptor}/rest/services/Parcels/Feature Server
- Service URL:
-
Click View to access the feature service. Locate the Service ItemId, which will look something like this:
- Service ItemID: b5d71d19fd4b43fbb88abf07773ec0c7
Please see ArcGIS Platform, ArcGIS Online or ArcGIS Enterprise steps to find the service URL and item ID.
Display features
To display features from the Santa Monica Parcels feature layer, you need to use a client-side mapping API such as an ArcGIS Maps SDK or open source library. Typically, you use a client-side feature layer class and set the item ID or the service URL and layer index to access the feature layer.
-
Select an ArcGIS Maps SDK or open source library.
-
In the layer item page, find the item ID or the service URL and layer index.
-
In the code, set the access token and either the item ID or the service URL.
-
Add the layer to the map.
const parcelsLayer = new FeatureLayer({
portalItem: {
id: "b5d71d19fd4b43fbb88abf07773ec0c7"
}
});
map.add(parcelsLayer);
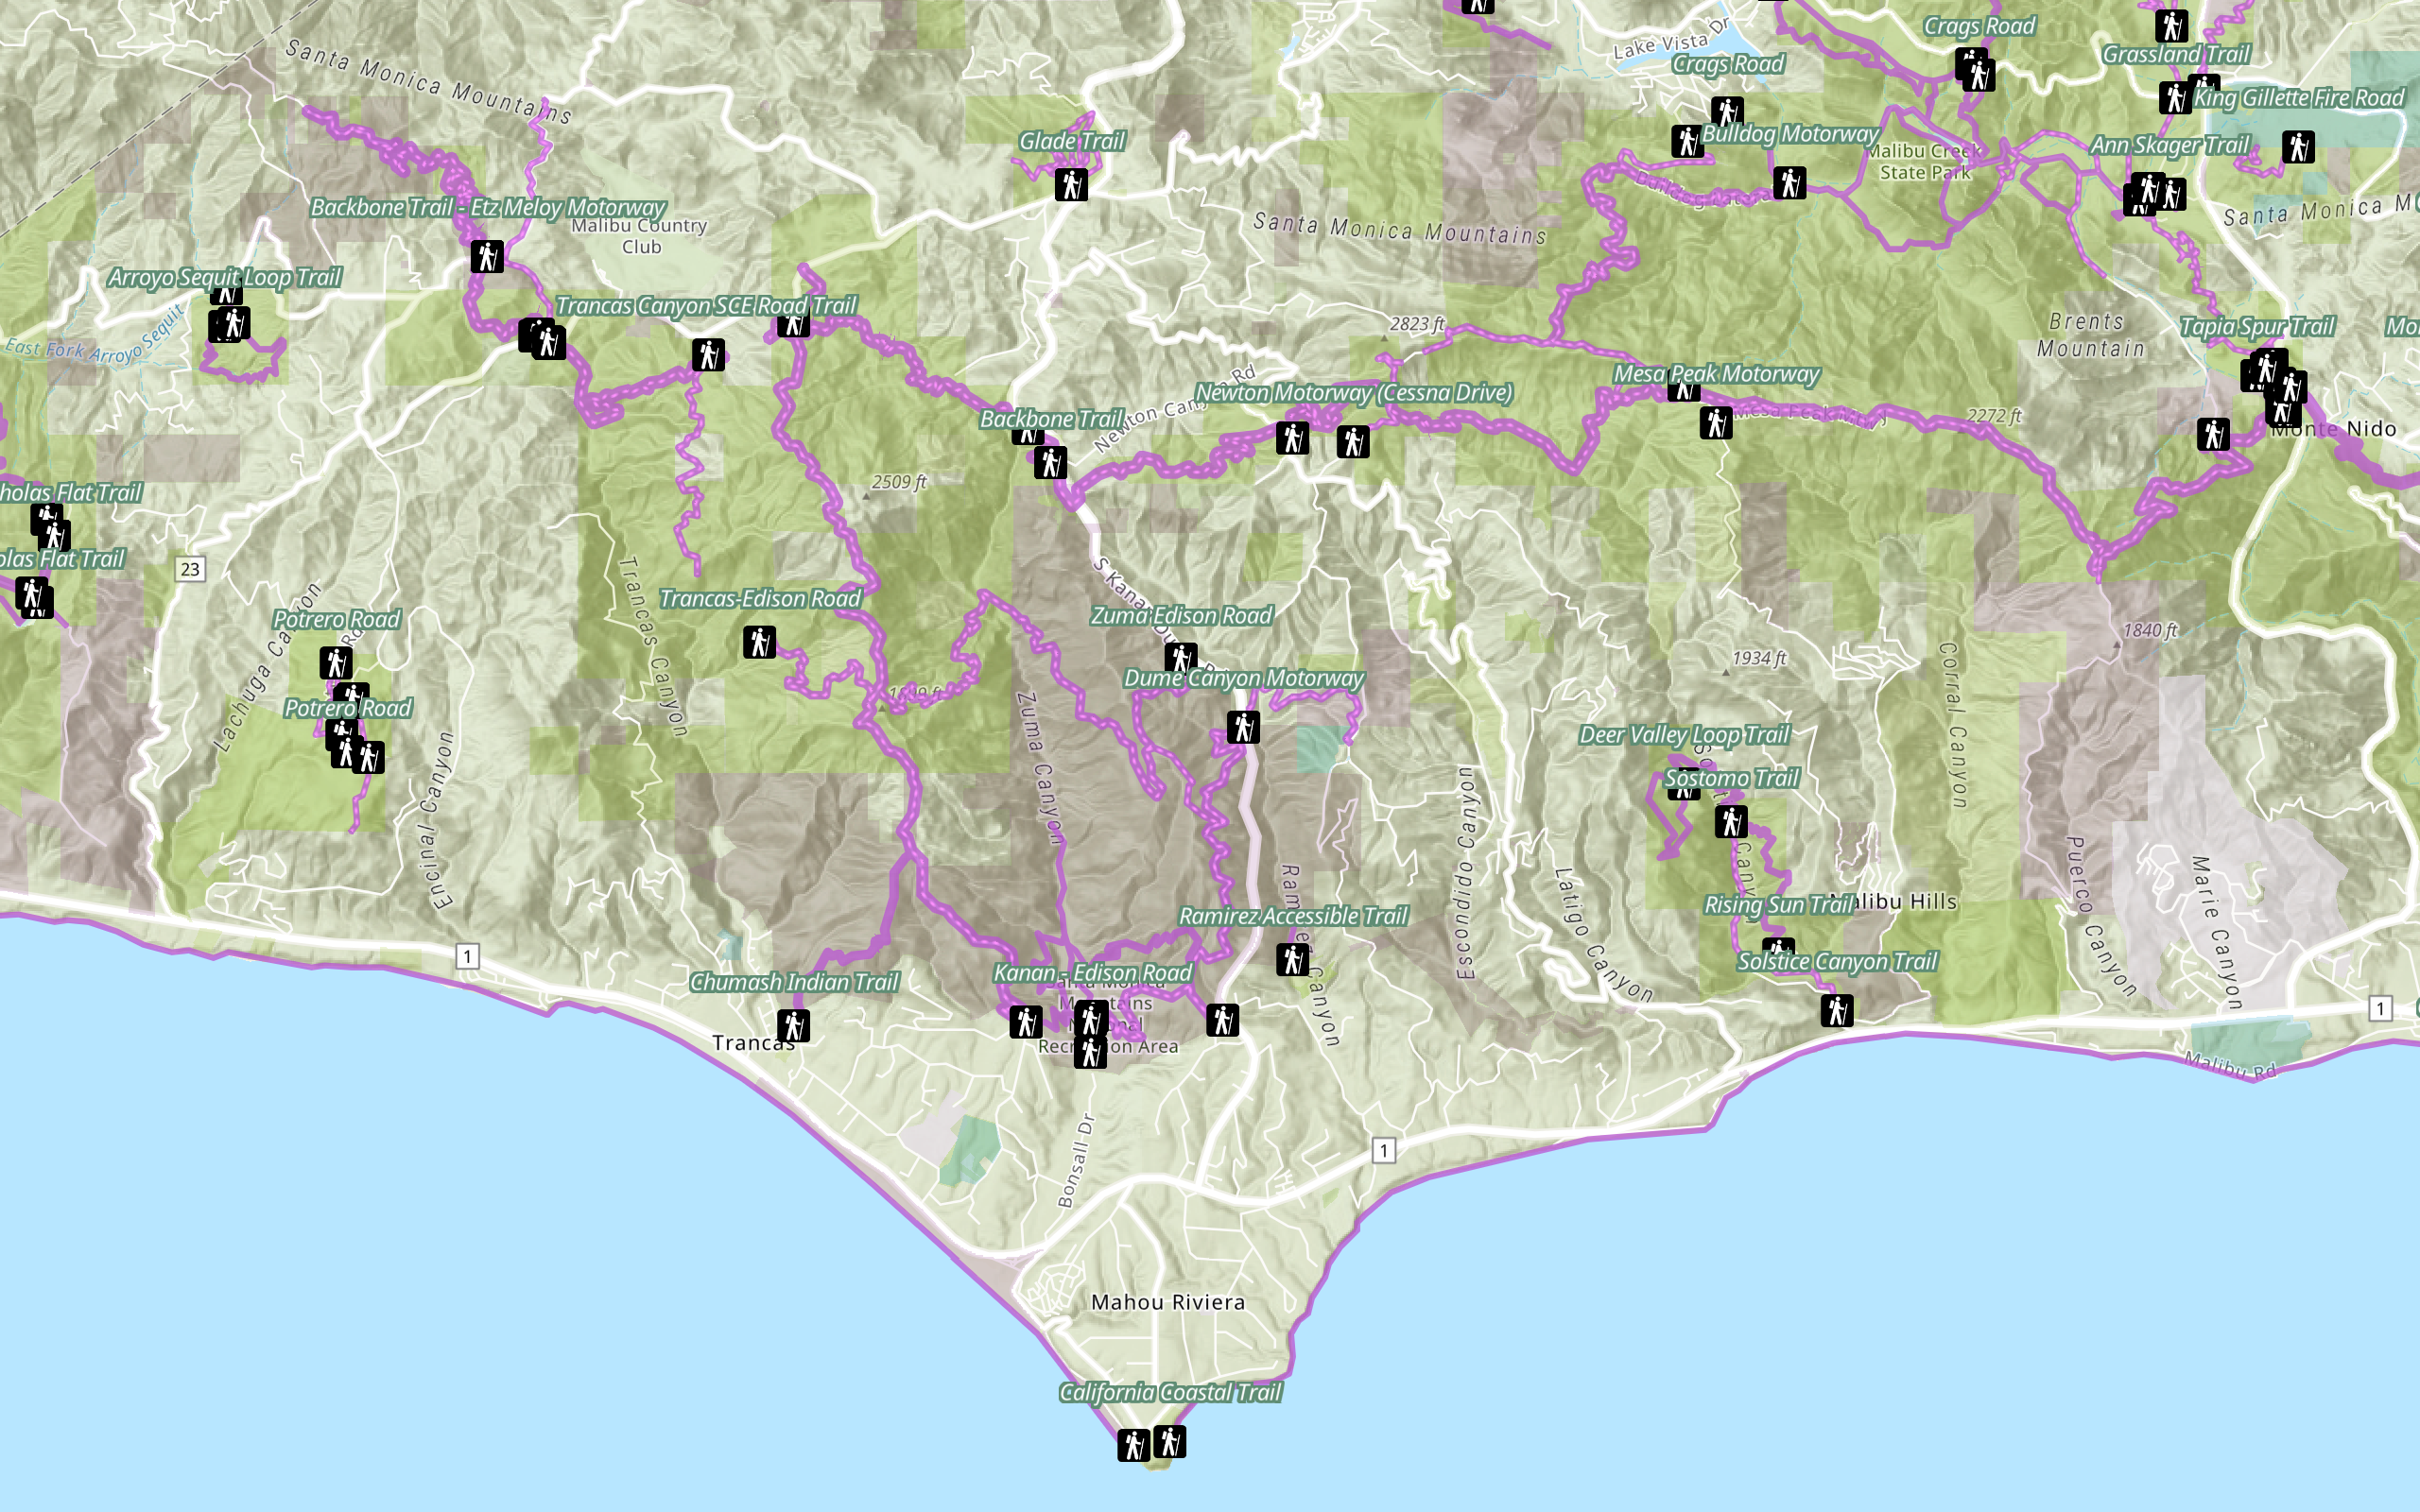
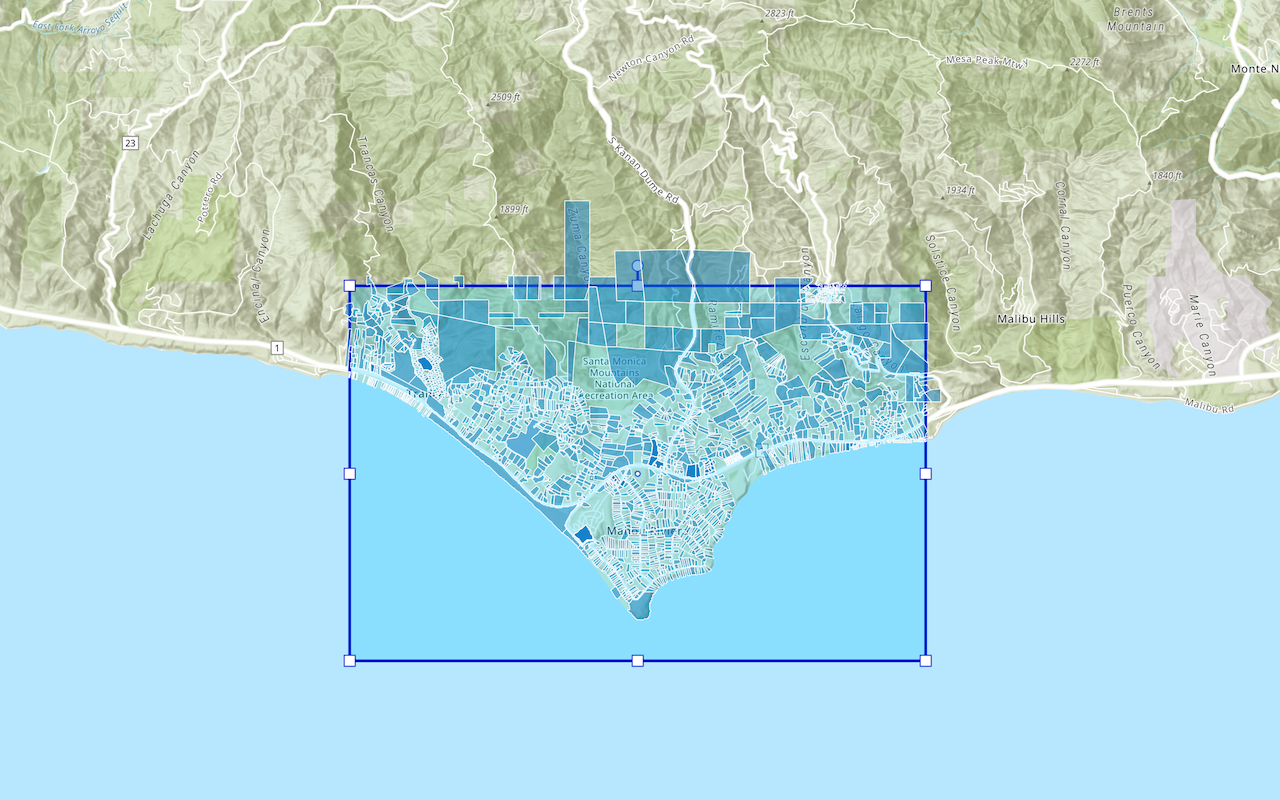
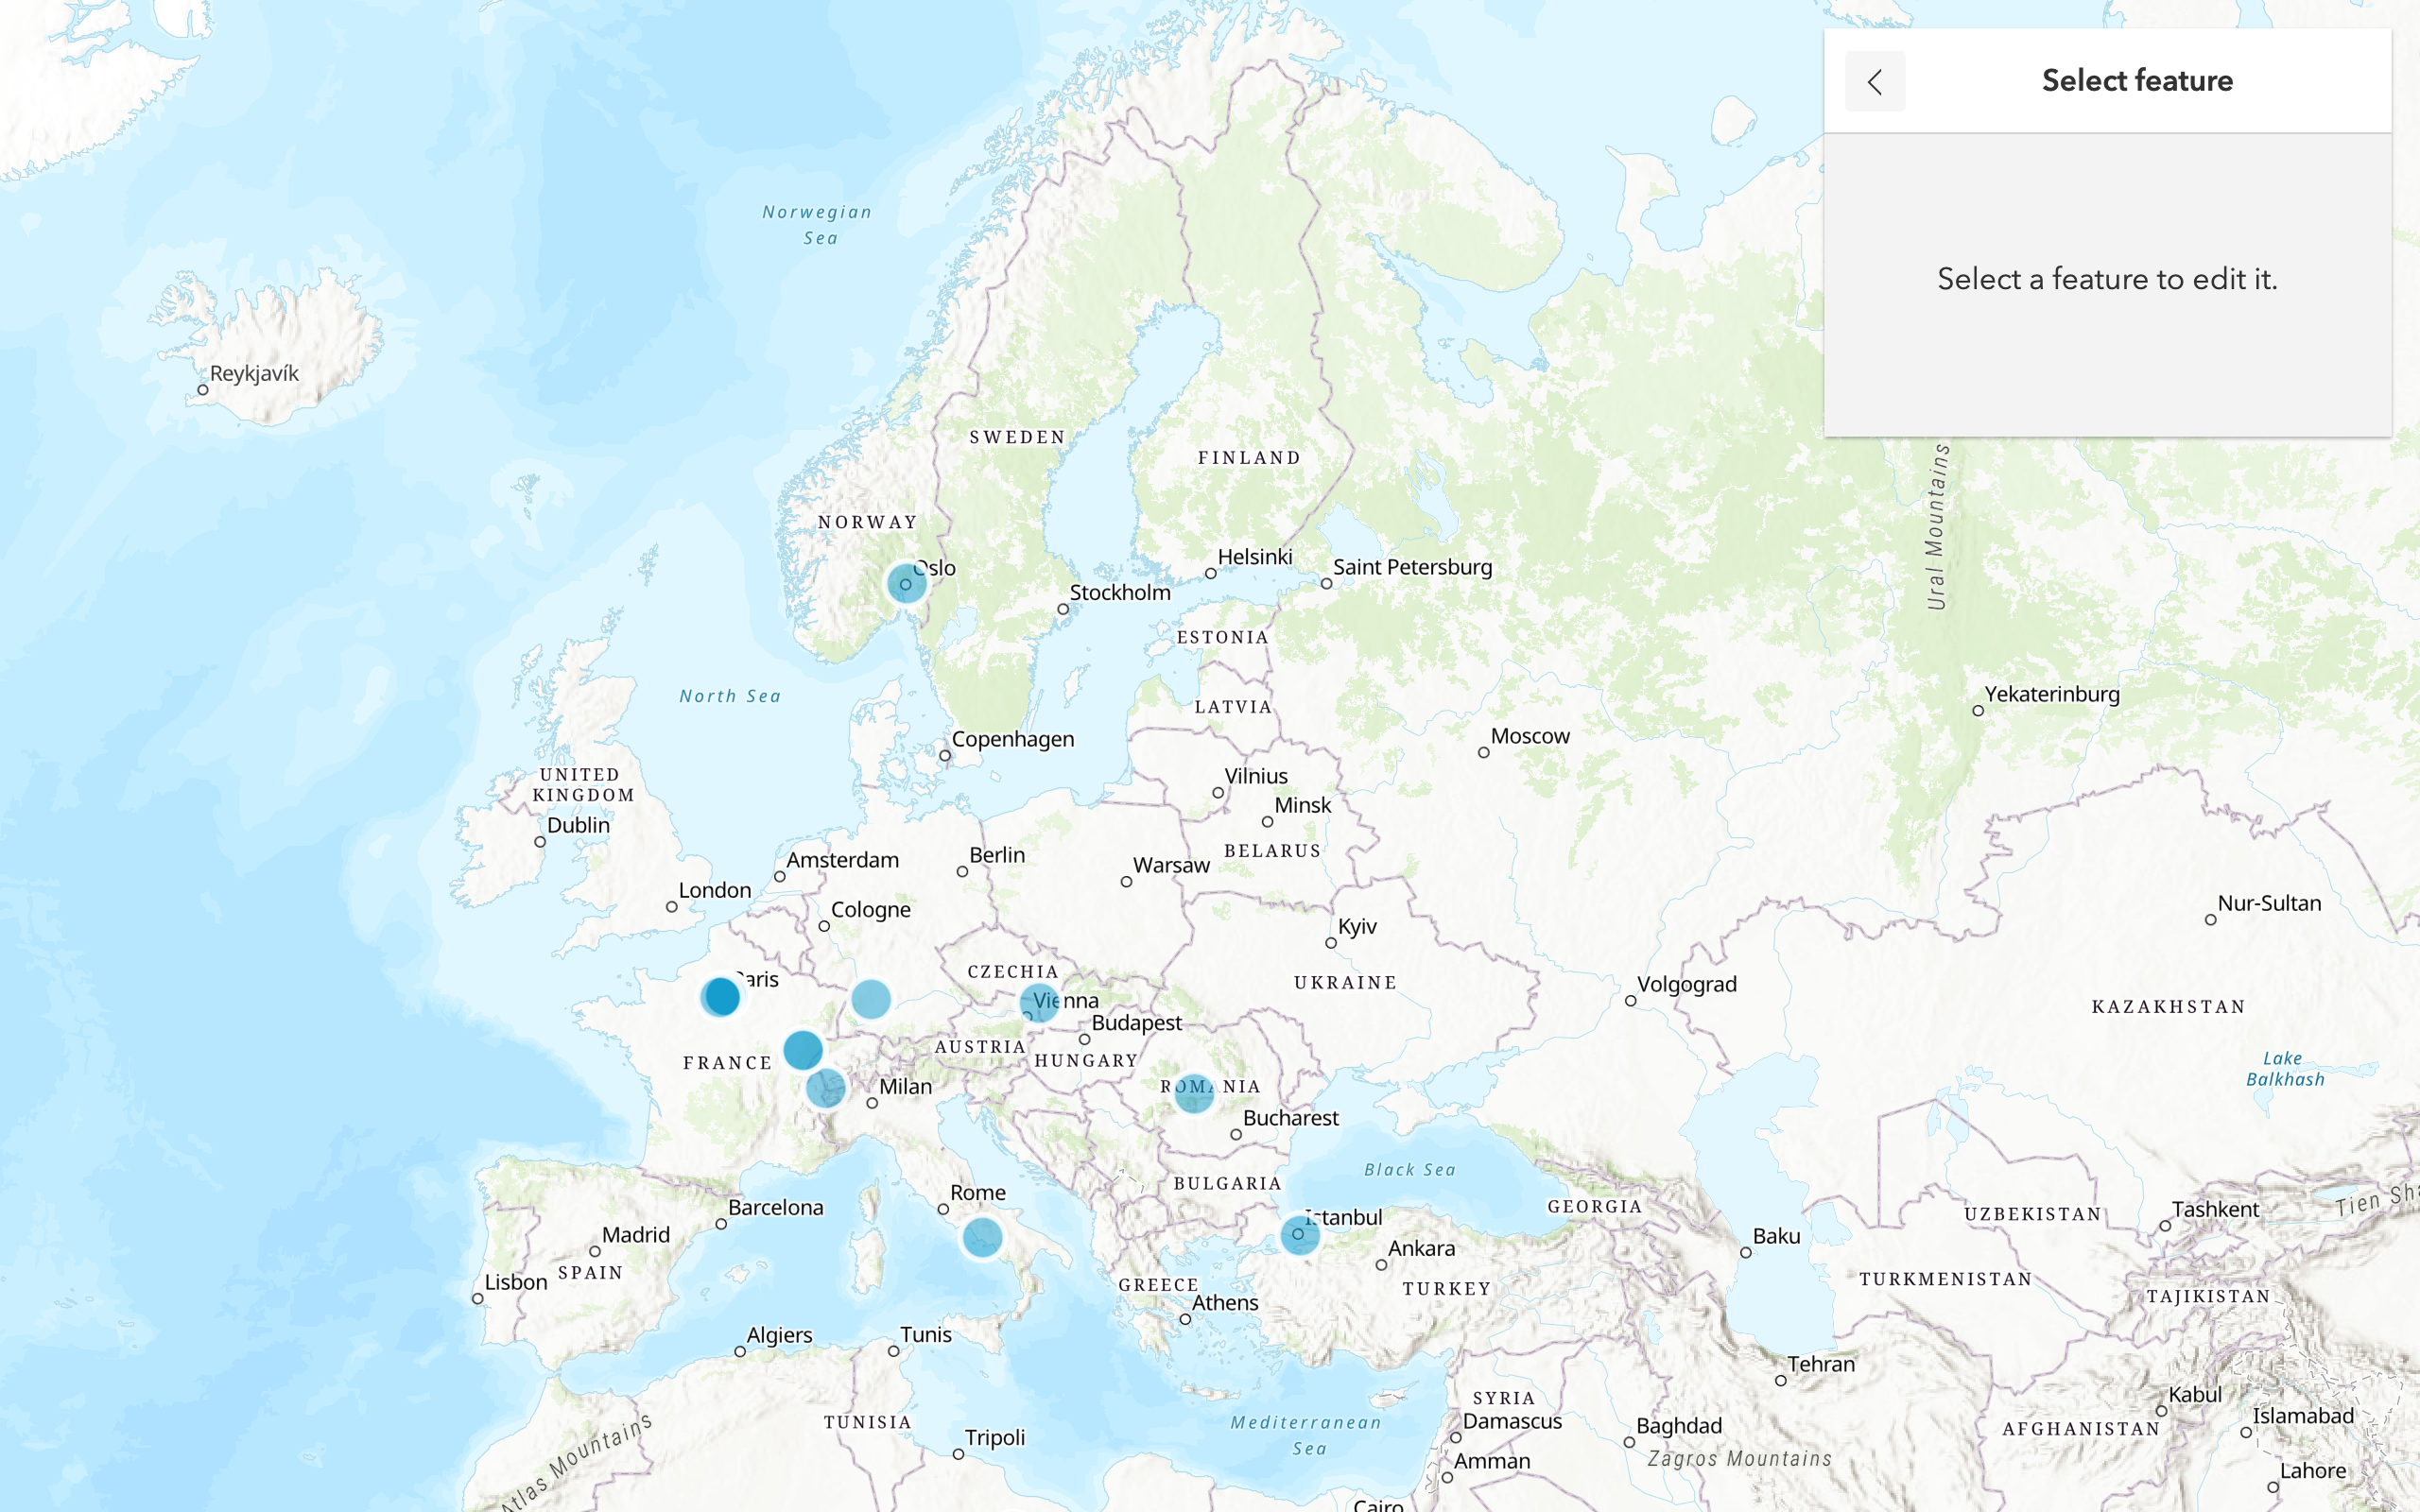
Your app will look something like this:
Display a popup
You can configure popups in your application to display attribute information, such as the parcel use type, description, address, and ID. Use an ArcGIS Maps SDK or open source library to display parcel information.
- Select an ArcGIS Maps SDK or open source library.
- Determine the feature attributes you want to display.
- Set the popup with the field names.
require([
"esri/config",
"esri/Map",
"esri/views/MapView",
"esri/layers/FeatureLayer"
], function(esriConfig, Map, MapView, FeatureLayer ) {
// const portal = new Portal({
// url: "https://www.arcgis.com/",
// authMode: "immediate"
// });
// OR
esriConfig.apiKey = "YOUR_API_KEY"; // Scoped to access the item below
const map = new Map({
basemap: "arcgis-light-gray" //Basemap layer service
});
const view = new MapView({
container: "viewDiv",
map: map,
center: [-118.49,34.01], //Longitude, latitude
zoom: 13
});
const popupParcels = {
"title": "Parcel",
"content": "<b>ID:</b> {ain} <br><b>Use type:</b> {usetype}<br><b>Description:</b> {usedescrip}<br><b>Address:</b> {situsfulla}"
}
// Create the layer and set the renderer and popup
const parcels = new FeatureLayer({
portalItem: {
id: "b5d71d19fd4b43fbb88abf07773ec0c7"
},
popupTemplate: popupParcels
});
// Add the layer
map.add(parcels);
});
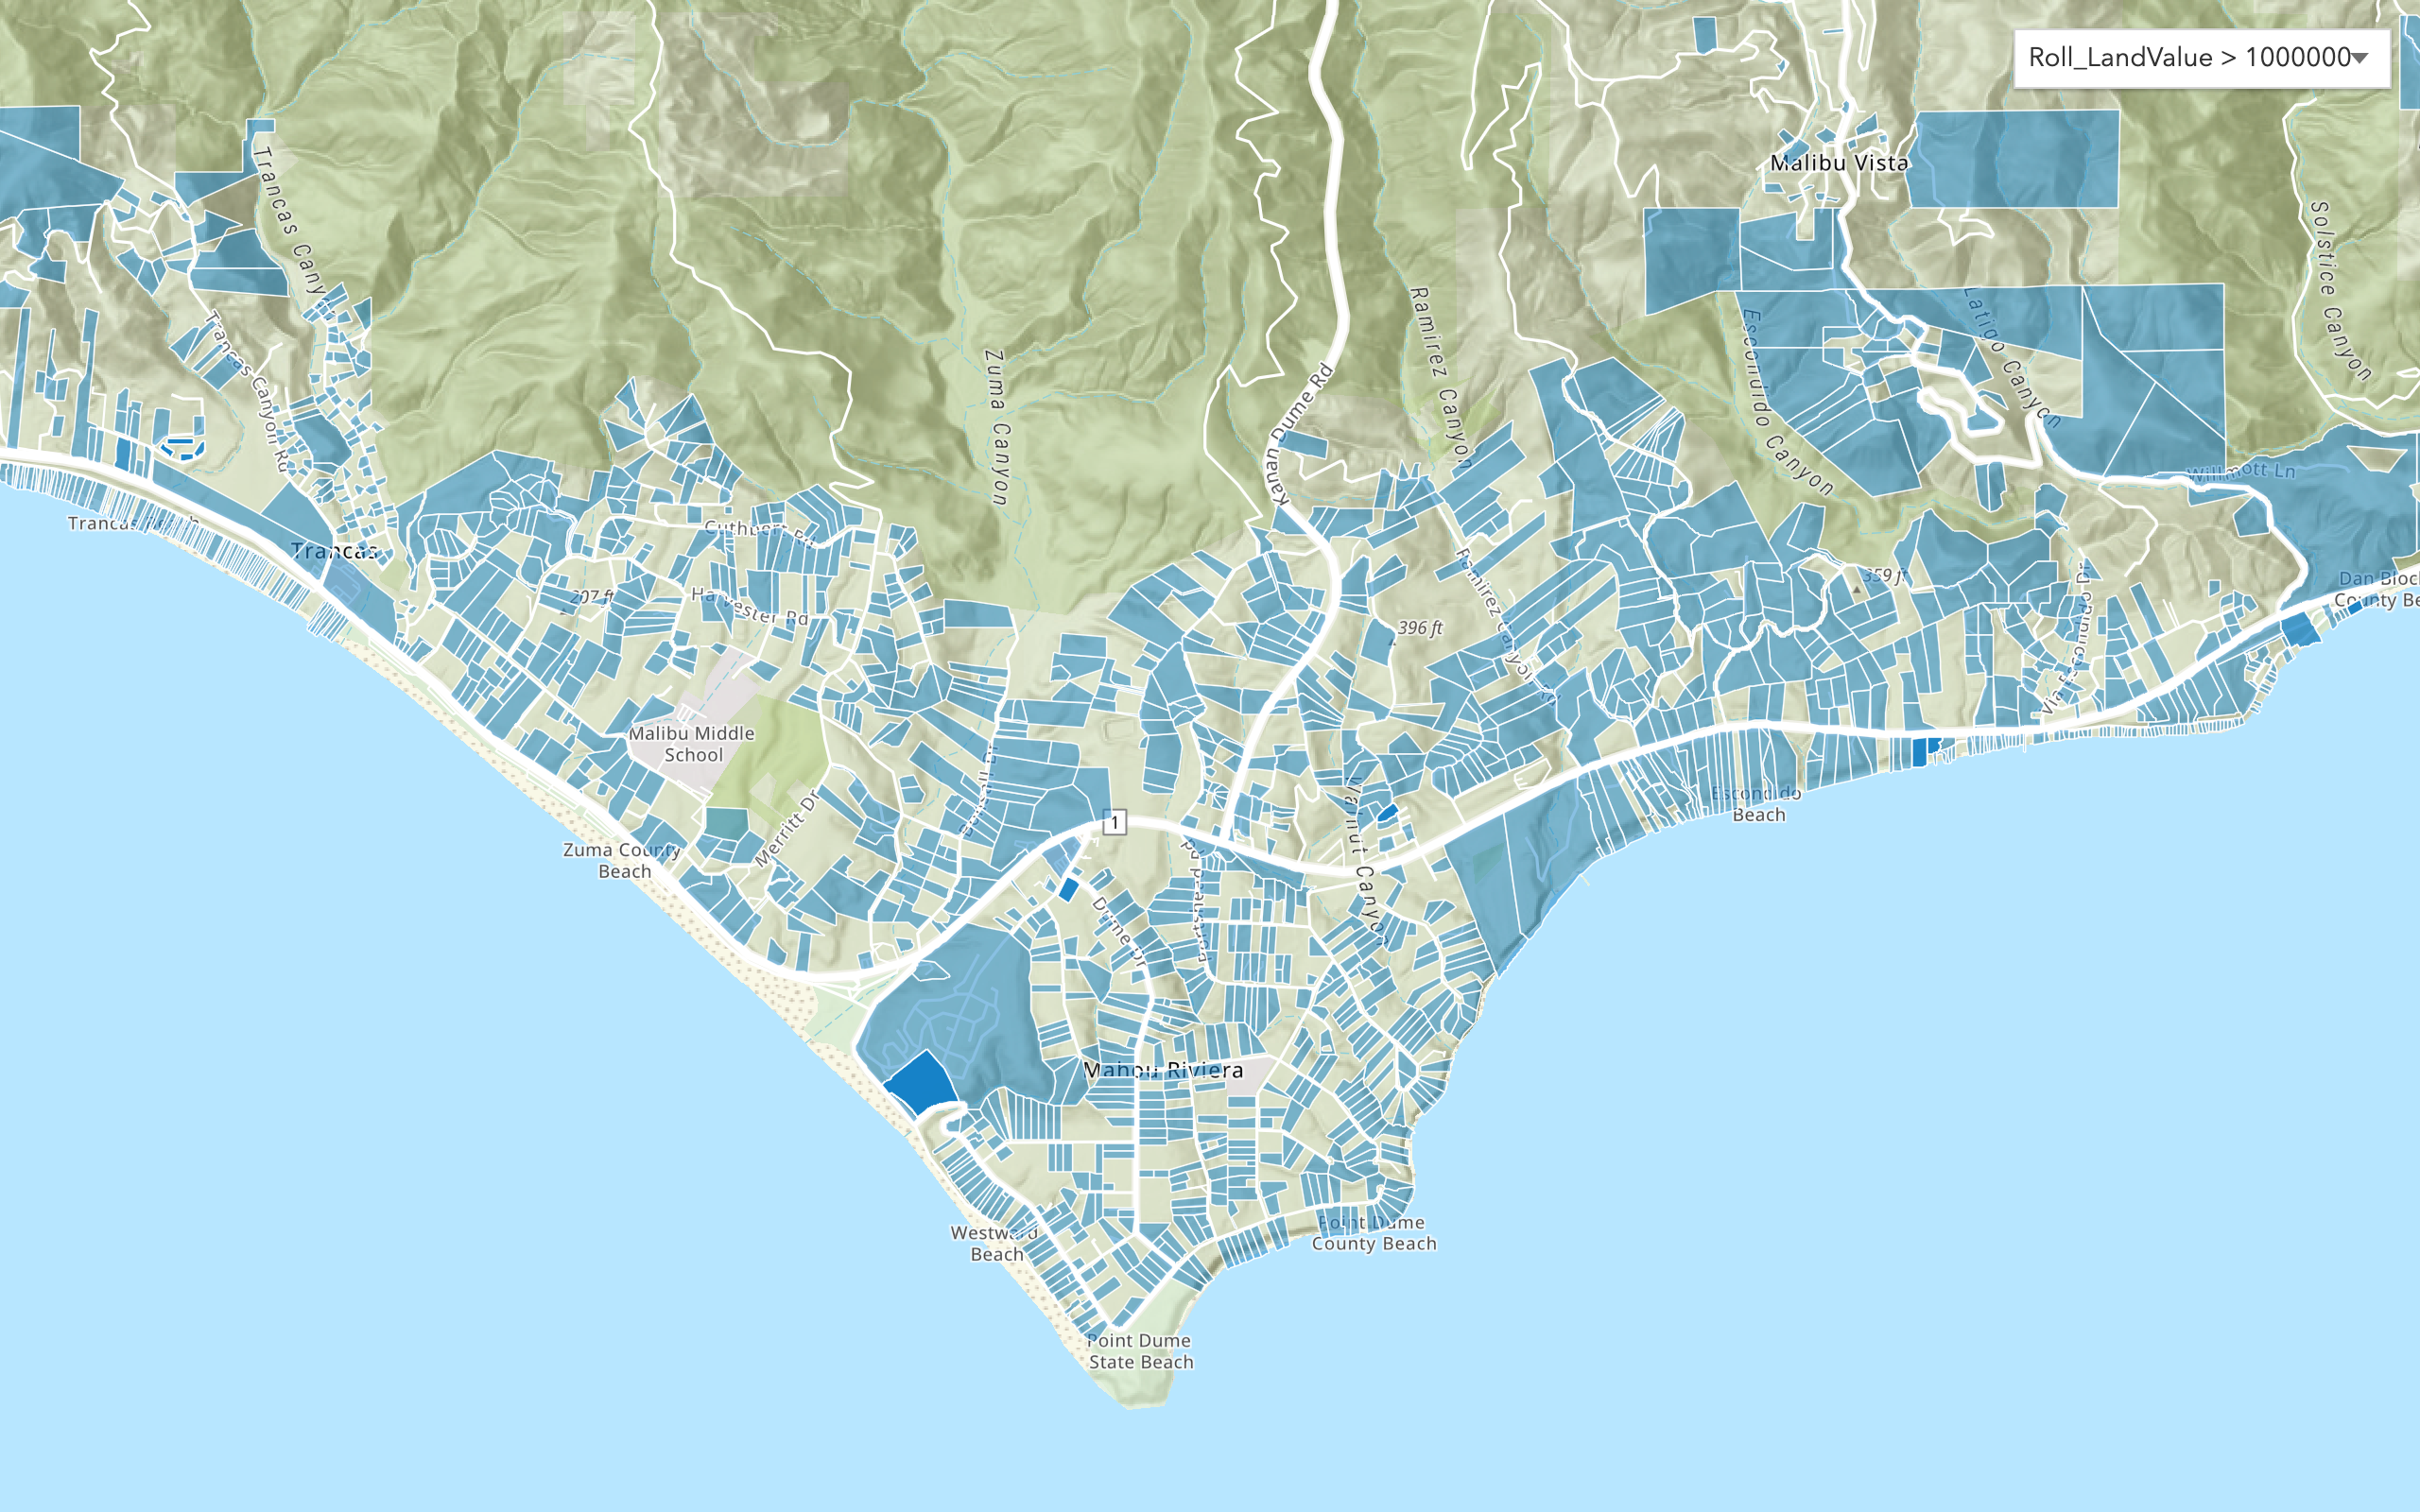
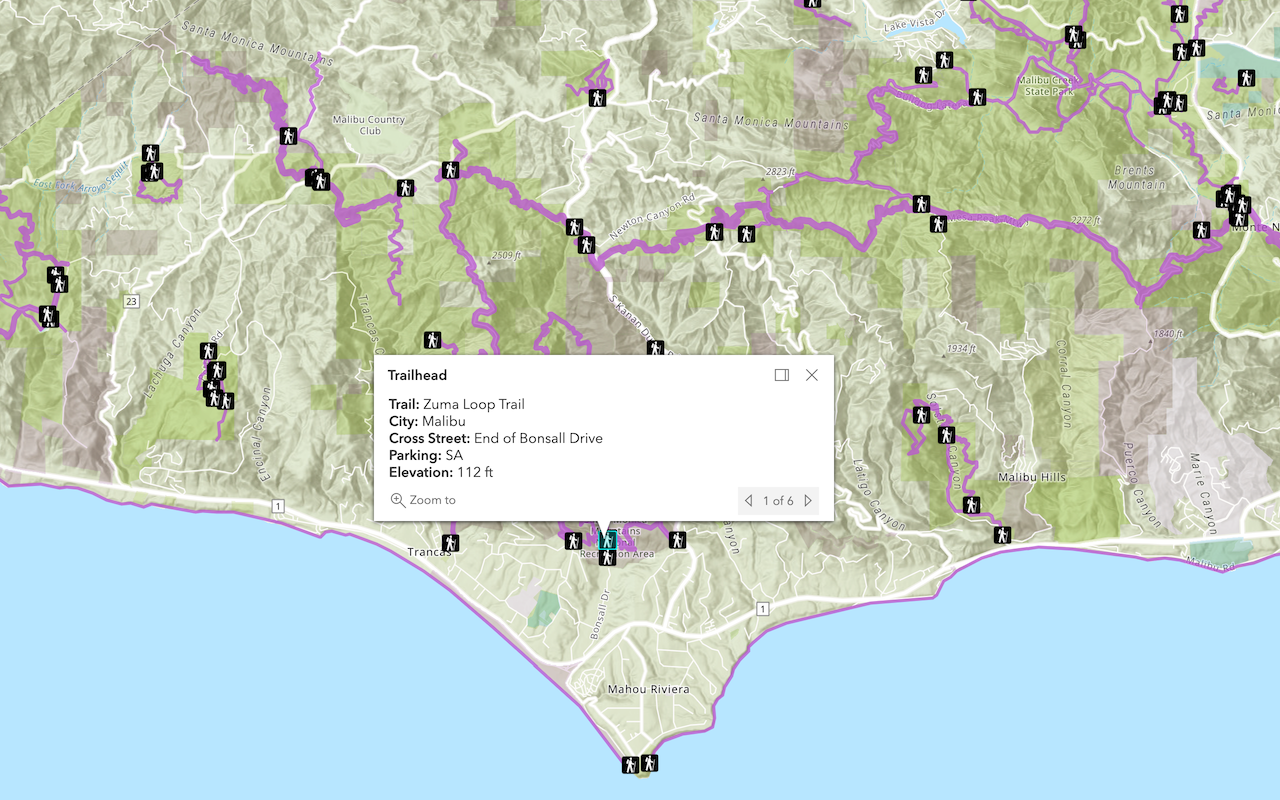
Your app will look something like this:
What's next?
Learn how to use additional tools, APIs, and location services in these tutorials:
Import data to create a feature layer
Use data management tools to import files and create a feature layer in a feature service.
Define a new feature layer
Use data management tools to define and create a new empty feature layer in a feature service.
Manage a feature layer
Use a hosted feature layer item to set the properties and settings of a feature layer in a feature service.
Create a vector tile service
Use data management tools to create a new vector tile service from a feature service.
Create a map tile service
Use ArcGIS Online or scripting APIs to publish a map tile service.
Add a feature layer
Access and display point, line, and polygon features from a feature service.
Add a vector tile layer
Access and display a vector tile layer in a map.
Add a map tile layer
Access and display a map tile layer in a map.
Style a feature layer
Use symbols and renderers to style feature layers.
Query a feature layer (spatial)
Execute a spatial query to get features from a feature layer.
Query a feature layer (SQL)
Execute a SQL query to access polygon features from a feature layer.
Edit feature data
Add, update, and delete features in a feature service.
Display a popup
Format a popup to show attributes in a feature layer.