What is a hot spot analysis?
A hot spot analysis is the process of determining if there are statistically significant clusters in spatial data. To execute the analysis, use the spatial analysis service and the Find operation.

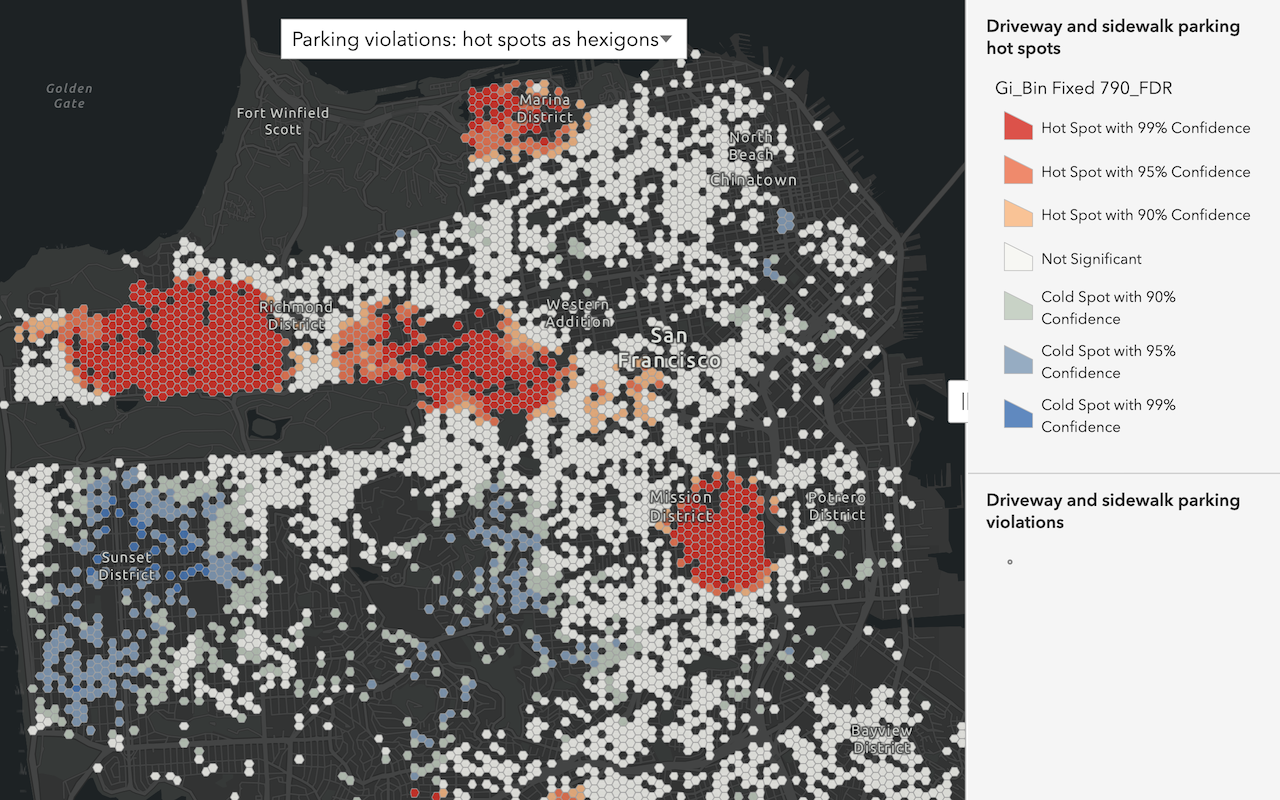
The analysis uses the (Gi* de Getis-Ord) equation to find groups of clusters of either point or polygon data based on high (hot) or low (cold) values, which are defined as the resultant z-scores and p-values. For a feature to be in a hot spot cluster, it must have a high value and be surrounded by other clusters with high values. For a feature to be in a cold spot cluster, the feature must have a low value and be surrounded by other clusters with low values.
A hot spot analysis helps to find spatial trends and patterns in the data that may not be visible at first glance.
Real-world examples of this analysis include the following:
- Finding high and low clusters of crime or traffic crash incidents.
- Discovering the distribution of high and low property values in an area.
- Determining where people are spending the most money in an area compared to another.
How to perform a hot spot analysis
- Review the parameters for the
Findoperation.H o t Spots - Send a request to get the spatial analysis service URL.
- Execute a job request with the following URL and parameters:
- URL:
https://< YOUR_ ANALYSIS_ SERVICE>/arcgis/rest/services/tasks/GPServer/Find H o t Spots/submit Job - Parameters:
analysis: Your dataset as a hosted feature layer or feature collection.Layer analysis: A numeric field.Field shape: Fishnet or Hexagon.Type output: A string representing the name of the hosted feature layer to reutrn with the results.Name
- URL:
- Check the status.
- Get the output layer results.
To see examples using ArcGIS API for Python, ArcGIS REST JS, and the ArcGIS REST API, go to Examples below.
URL request
http://<YOUR_ANALYSIS_SERVICE>/arcgis/rest/services/tasks/GPServer/FindHotSpots/submitJob?<parameters>Required parameters
| Name | Description | Examples |
|---|---|---|
f | The format of the data returned. | f=json f=pjson |
token | An OAuth 2.0 access token. Learn how to get an access token in Security and authentication. | token=< |
analysis | The point or polygon feature layer. | {url: |
analysis | Use if the analysis layer contains polygons. | counts, rates, averages |
Key parameters
| Name | Description | Examples |
|---|---|---|
shape | Use if the analysis layer contains points. | hexagon, fishnet |
bounding | When the analysis layer contains points and no analysis is specified, you can provide a boundary for the analysis. | {url: |
output | A string representing the name of the hosted feature layer to return with the results. NOTE: If you do not include this parameter, the results are returned as a feature collection (JSON). | {"service |
context | A bounding box or output spatial reference for the analysis. | "extent":{"xmin: |
Code examples
Find traffic crash hot spots
This example uses the Find operation to determine where there are statistically significant clusters of Traffic crashes counted within a fishnet grid. The red clusters represent a statistically high number of crashes. The blue spots represent a statistically low number of crashes.
In the analysis, the analysis value is the Traffic crashes hosted feature layer. The points in the layer are counted within a fishnet, which was set in the shape parameter.
APIs
traffic_crashes = "https://services3.arcgis.com/GVgbJbqm8hXASVYi/arcgis/rest/services/Traffic_Crashes/FeatureServer/0"
fishnet = "fishnet"
results = find_hot_spots(
analysis_layer=traffic_crashes,
shape_type=fishnet,
# Outputs results as a hosted feature layer.
output_name="Hot spot analysis results",
)
result_features = results.layers[0].query()
print(f"The hot spot layer has {len(result_features.features)} new records")
Service requests
Request
POST arcgis.com/sharing/rest/portals/self HTTP/1.1
Content-Type: application/x-www-form-urlencoded
&f=json
&token=<ACCESS_TOKEN>Response (JSON)
{
"helperServices": {
// Other parameters
"analysis": {
"url": "https://<YOUR_ANALYSIS_SERVICE>/arcgis/rest/services/tasks/GPServer"
},
"geoenrichment": {
"url": "https://geoenrich.arcgis.com/arcgis/rest/services/World/GeoenrichmentServer"
}
}
}Request
POST <YOUR_ANALYSIS_SERVICE>/arcgis/rest/services/tasks/GPServer/FindHotSpots/submitJob HTTP/1.1
Content-Type: application/x-www-form-urlencoded
&f=json
&token=<ACCESS_TOKEN>
&analysisLayer={"url":"https://services3.arcgis.com/GVgbJbqm8hXASVYi/arcgis/rest/services/Traffic_Crashes/FeatureServer/0"}
&shapeType=fishnet
&returnProcessInfo=true
&outputName={"serviceProperties":{"name":"Find hot spot results"}}
&context={}
Response (JSON)
{
"jobId": "<JOB_ID>",
"jobStatus": "esriJobSubmitted",
"results": {},
"inputs": {},
"messages": []
}
Request
POST <YOUR_ANALYSIS_SERVICE>/arcgis/rest/services/tasks/GPServer/FindHotSpots/jobs/<JOB_ID> HTTP/1.1
Content-Type: application/x-www-form-urlencoded
&f=json
&token=<ACCESS_TOKEN>
Response (JSON)
// Executing job
{
"jobId": "<JOB_ID>",
"jobStatus": "esriJobExecuting",
"results": {},
"inputs": {},
"messages": []
}
// Job succeeded
{
"jobId": "<JOB_ID>",
"jobStatus": "esriJobSucceeded",
"results": {
"hotSpotsResultLayer": {
"paramUrl": "results/hotSpotsResultLayer"
},
"processInfo": {
"paramUrl": "results/processInfo"
}
},
"inputs": {},
"messages": []
}
Request
POST <YOUR_ANALYSIS_SERVICE>/arcgis/rest/services/tasks/GPServer/FindHotSpots/jobs/<JOB_ID>/results/hotSpotsResultLayer HTTP/1.1
Content-Type: application/x-www-form-urlencoded
&f=json
&returnType=data
&token=<ACCESS_TOKEN>Response (JSON)
{
"paramName": "hotSpotsResultLayer",
"dataType": "GPString",
"value": {
"url": "<SERVICE_URL>",
"itemId": "<ITEM_ID>"
}
}Identify high and low home values
This example uses the Find operation to determine where there are statistically significant hot and cold spots for home values in Portland. The hot and cold spots, shown as red and blue respectively, indicate whether a home's value is in a statistically high or low cluster.
In the analysis, the analysis value is the Enriched Portland hexagon bins hosted feature layer. The feature layer was created using generated hexagon bins that were enriched using data from the GeoEnrichment service. To analyze home values, you set the analysis with the AVG_ attribute.
To learn how to generate hexagon bins, go to generate tessellations.
APIs
pdx_homes = {
"url": "https://services3.arcgis.com/GVgbJbqm8hXASVYi/arcgis/rest/services/Enriched_PDX_hex_bin_tessellations/FeatureServer/0",
"filter": "AVGVAL_CY <> 0",
}
value = "AVGVAL_CY"
results = find_hot_spots(
analysis_layer=pdx_homes,
analysis_field=value,
# Outputs results as a hosted feature layer.
output_name="Hot spot analysis results",
)
result_features = results.layers[0].query()
print(f"The hot spot layer has {len(result_features.features)} new records")
Service requests
Request
POST arcgis.com/sharing/rest/portals/self HTTP/1.1
Content-Type: application/x-www-form-urlencoded
&f=json
&token=<ACCESS_TOKEN>Response (JSON)
{
"helperServices": {
// Other parameters
"analysis": {
"url": "https://<YOUR_ANALYSIS_SERVICE>/arcgis/rest/services/tasks/GPServer"
},
"geoenrichment": {
"url": "https://geoenrich.arcgis.com/arcgis/rest/services/World/GeoenrichmentServer"
}
}
}Request
POST <YOUR_ANALYSIS_SERVICE>/arcgis/rest/services/tasks/GPServer/FindHotSpots/submitJob HTTP/1.1
Content-Type: application/x-www-form-urlencoded
&f=json
&token=<ACCESS_TOKEN>
&analysisLayer={"url":"https://services3.arcgis.com/GVgbJbqm8hXASVYi/arcgis/rest/services/Enriched_PDX_hex_bin_tessellations/FeatureServer/0","filter":"AVGVAL_CY <> 0"}
&analysisField=AVGVAL_CY
&returnProcessInfo=true
&outputName={"serviceProperties":{"name":"Find hot spot results"}}
&context={"extent":{"xmin":-13701588.357587751,"ymin":5636873.660541155,"xmax":-13554599.952195555,"ymax":5730585.457218655,"spatialReference":{"wkid":102100,"latestWkid":3857}}}
Response (JSON)
{
"jobId": "<JOB_ID>",
"jobStatus": "esriJobSubmitted",
"results": {},
"inputs": {},
"messages": []
}
Request
POST <YOUR_ANALYSIS_SERVICE>/arcgis/rest/services/tasks/GPServer/FindHotSpots/jobs/<JOB_ID> HTTP/1.1
Content-Type: application/x-www-form-urlencoded
&f=json
&token=<ACCESS_TOKEN>
Response (JSON)
// Executing job
{
"jobId": "<JOB_ID>",
"jobStatus": "esriJobExecuting",
"results": {},
"inputs": {},
"messages": []
}
// Job succeeded
{
"jobId": "<JOB_ID>",
"jobStatus": "esriJobSucceeded",
"results": {
"hotSpotsResultLayer": {
"paramUrl": "results/hotSpotsResultLayer"
},
"processInfo": {
"paramUrl": "results/processInfo"
}
},
"inputs": {},
"messages": []
}
Request
POST <YOUR_ANALYSIS_SERVICE>/arcgis/rest/services/tasks/GPServer/FindHotSpots/jobs/<JOB_ID>/results/hotSpotsResultLayer HTTP/1.1
Content-Type: application/x-www-form-urlencoded
&f=json
&returnType=data
&token=<ACCESS_TOKEN>Response (JSON)
{
"paramName": "hotSpotsResultLayer",
"dataType": "GPString",
"value": {
"url": "<SERVICE_URL>",
"itemId": "<ITEM_ID>"
}
}Tutorials
Learn how to perform related analyses interactively with Map Viewer and programmatically with ArcGIS API for Python, ArcGIS REST JS, and ArcGIS REST API.
Services
Spatial analysis service
Process spatial datasets to discover relationships and patterns.
API support
| Find hot spots | Find outliers | Find point clusters | Calculate density | Interpolate points | |
|---|---|---|---|---|---|
| ArcGIS Maps SDK for JavaScript | 1 | 1 | 1 | 1 | 1 |
| ArcGIS Maps SDK for .NET | |||||
| ArcGIS Maps SDK for Kotlin | |||||
| ArcGIS Maps SDK for Swift | |||||
| ArcGIS Maps SDK for Java | |||||
| ArcGIS Maps SDK for Qt | |||||
| ArcGIS API for Python | |||||
| ArcGIS REST JS | 1 | 1 | 1 | 1 | 1 |
| Esri Leaflet | 2 | 2 | 2 | 2 | 2 |
| MapBox GL JS | 2 | 2 | 2 | 2 | 2 |
| OpenLayers | 2 | 2 | 2 | 2 | 2 |
- 1. Access with geoprocessing task
- 2. Access via ArcGIS REST JS