This section covers how to perform a 3D visual analysis. To run an analysis, you can use ArcGIS APIs, ArcGIS Pro, or Scene Viewer.
Steps to perform 3D visual analysis
The general steps to perform 3D visual analysis are as follows:
1. Create a scene
To perform a 3D visual analysis, you need to create a scene. A scene provides the geographic context for the analysis and a way to display the results. You can perform analyses on the scene's terrain (represented by an elevation layer) or you can add additional 3D layers with features such as buildings. When the analysis is complete, you use the scene and the scene view to display the results.
The general steps to create a scene are:
- Create a global or local scene.
- Set the camera height, heading, and tilt.
- Set the ground location and zoom level.
- Add elevation and terrain layers (if required).
- Add other 3D elements and layers (if required).
2. Select an operation
There are several different types of 3D visual analysis operations that you can perform. The operation you use depends on the type of problem you would like to solve. Use the table of categories below to help select the correct operation. For more details about each, go to the links below.
| Category | Description | Operations | Results | Example |
|---|---|---|---|---|
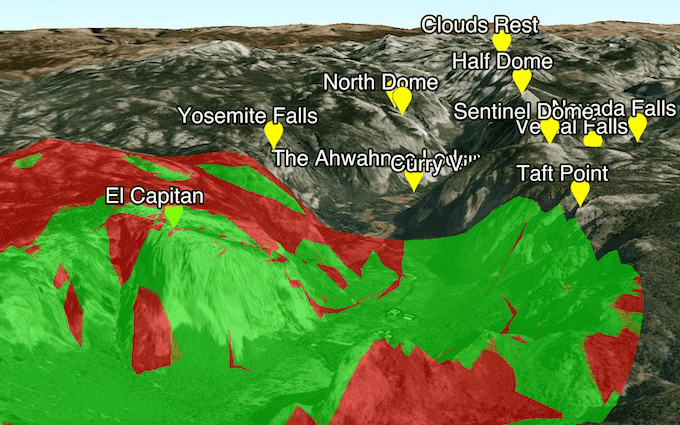
| Viewshed | Calculates and displays the visibility of surroundings from an observer's perspective in a scene. Only available with the ArcGIS Maps SDKs for Native Apps. | Location, Location, Geo | A viewshed overlay representing what can and cannot be seen by an observer. |

|
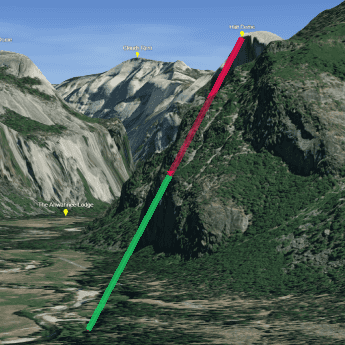
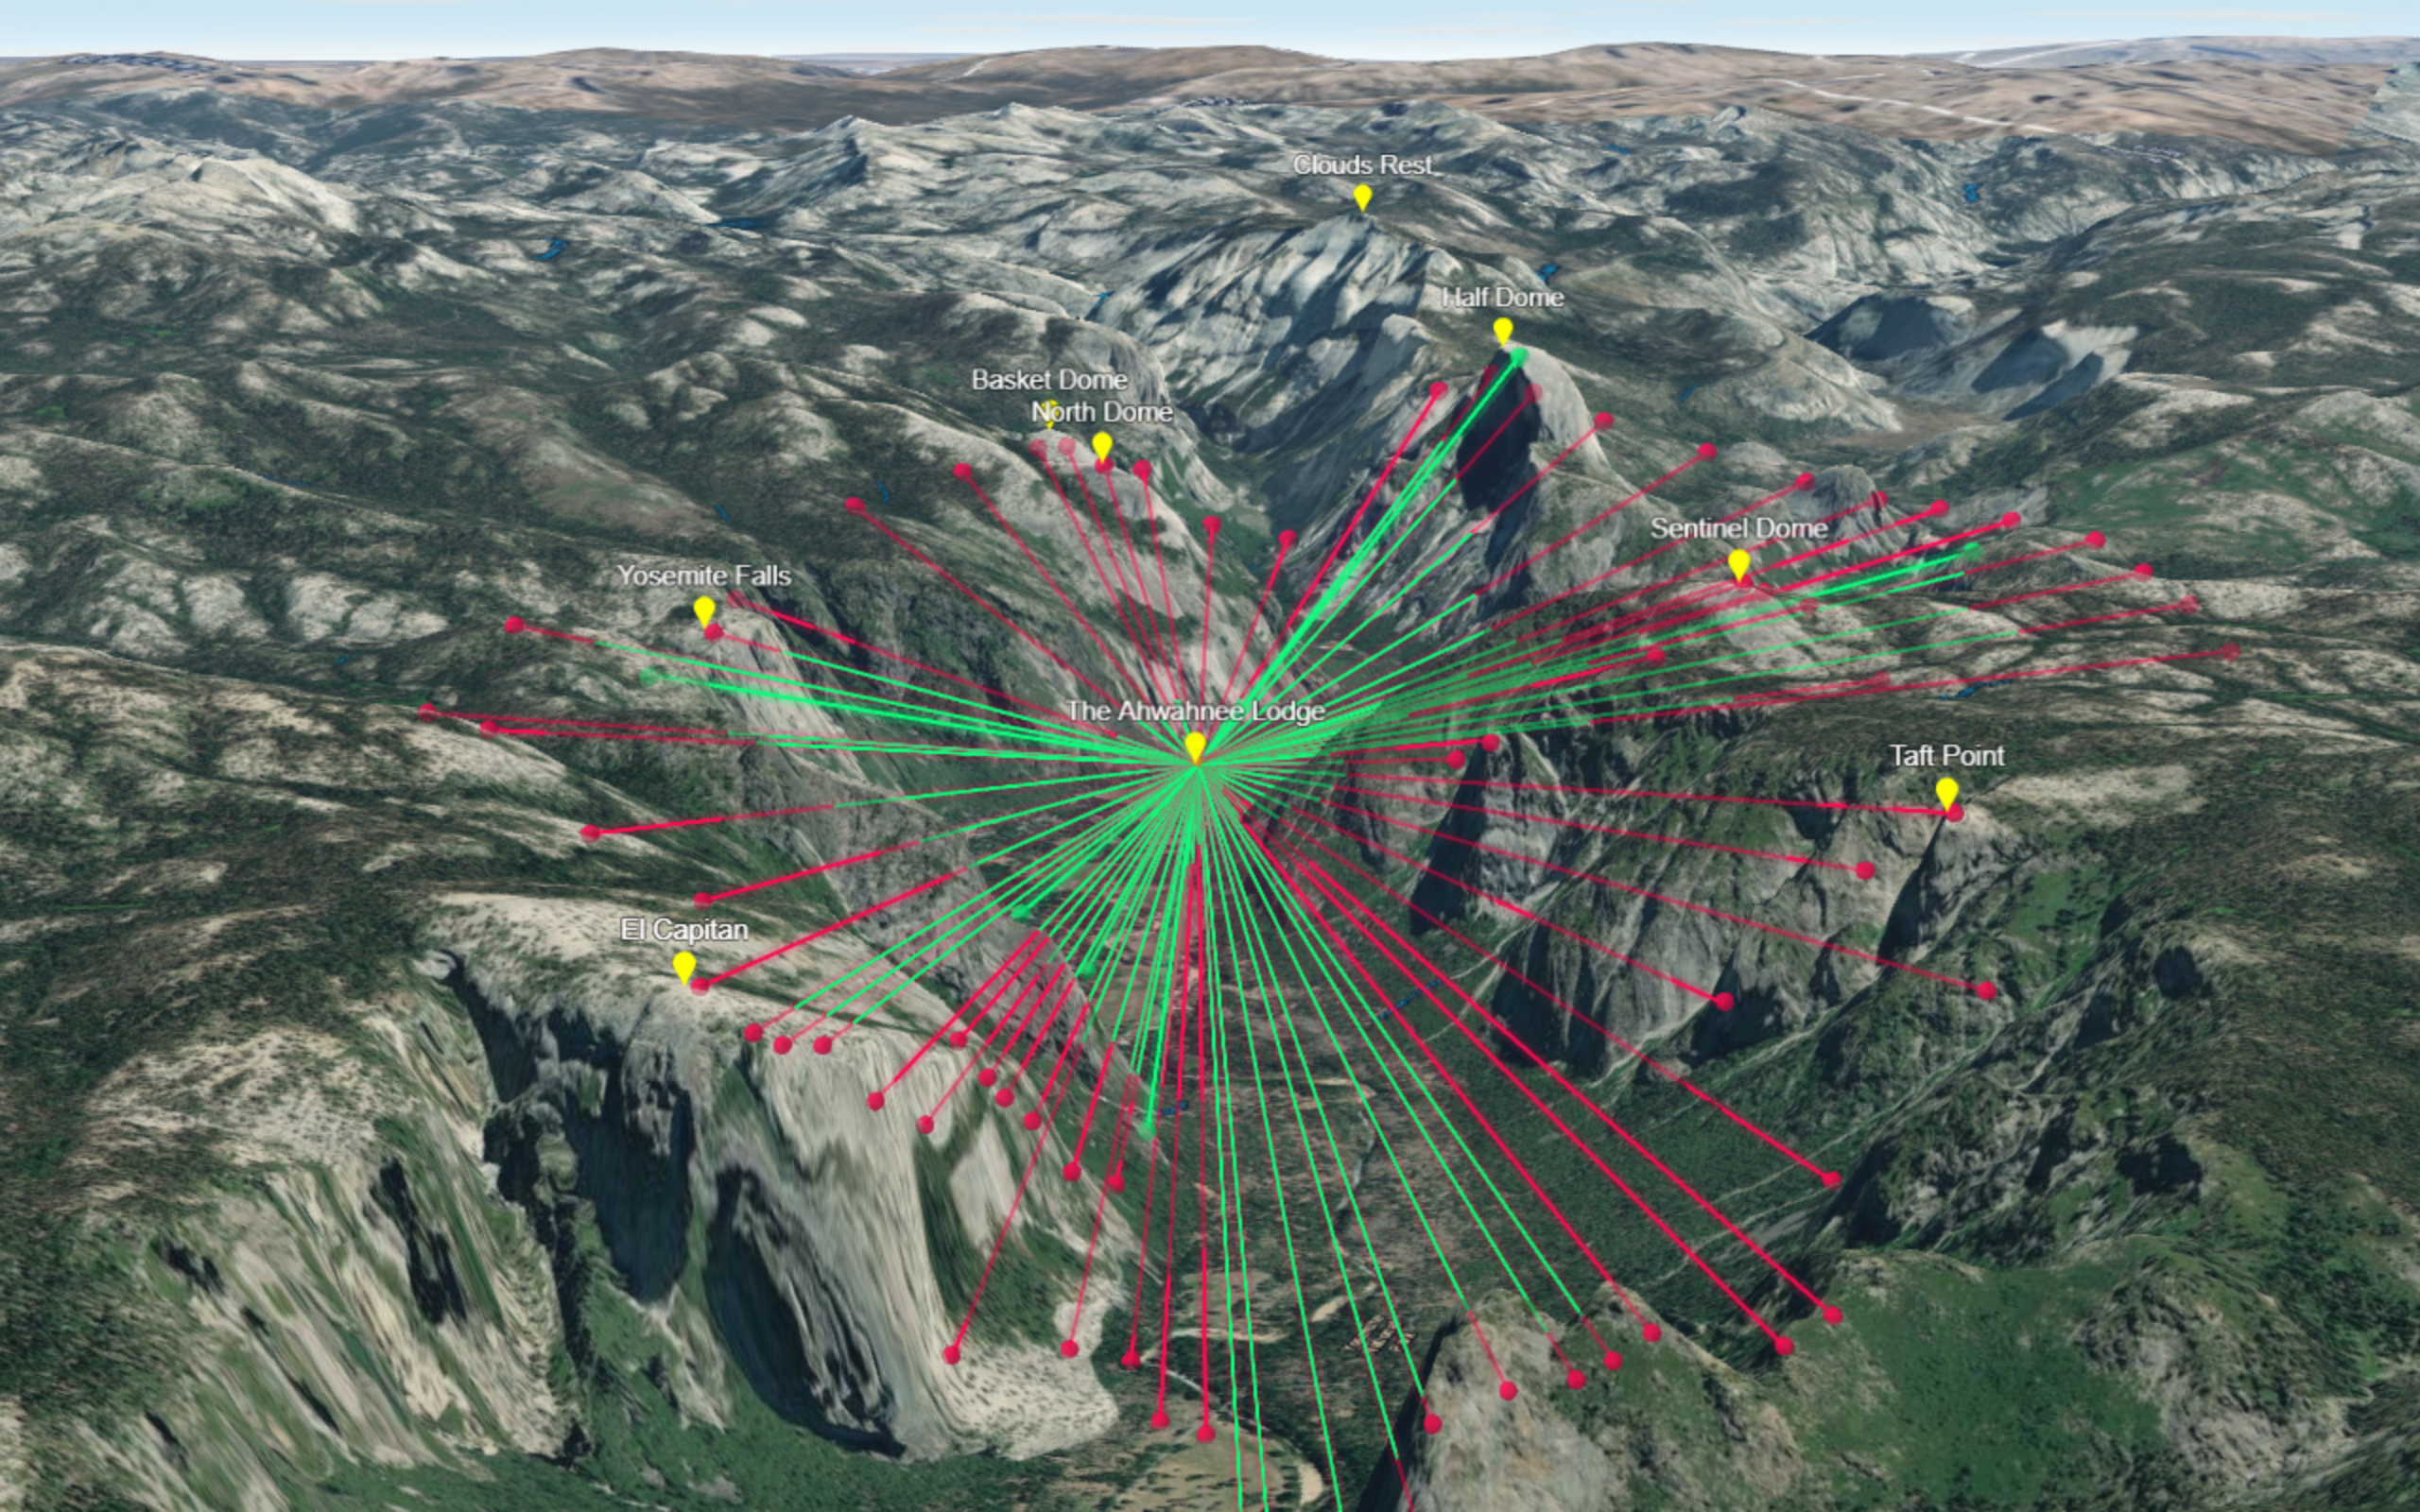
| Line of sight | Calculates if a target location is visible from an observer location in a scene. | Location, Geo | A line indicating visibility, divided into segments based on what can be seen and what is obstructed. |
|
| Distance Measurement | Calculates and displays the distance between two points in a scene. | Location, Direct | An overlay containing a line feature and its corresponding distance measurement. |

|
| Area Measurement | Calculates and displays the area of a polygon in a scene. | Area | An overlay containing a polygon feature and its corresponding area measurement. |

|
3. Perform the analysis
3D visual analysis operations can be performed programmatically using ArcGIS APIs or interactively using ArcGIS tools. Regardless of the mechanism you use, the process for performing the analysis is similar.
All 3D visual analyses require you to define parameters for the operation. All analyses require one or more locations. For example, line of sight analysis requires an observer location as well as target locations to determine if the targets are visible from the observer.
Some 3D visual operations require additional parameters. For example, a viewshed analysis requires several properties that define an observer's perspective and field of view, while area measurement requires a polygon feature that represents the measurement extent.
ArcGIS APIs
You can use ArcGIS Maps SDKs for Native Apps and the ArcGIS Maps SDK for JavaScript to perform 3D visual analyses. ArcGIS Maps SDKs for Native Apps support visual analysis using either points or geoelements, while the JavaScript Maps API only supports points. The JavaScript Maps API also provides widgets that allow you to perform interactive analyses in a scene view.
The general steps to perform a visual analysis with an ArcGIS Maps SDK for Native Apps are:
-
Select an ArcGIS Maps SDK for Native Apps and create a new project in the corresponding programming language.
-
Add a scene view to your application and include any additional data layers you would like to incorporate into the analysis.
-
Create a new analysis object for the 3D visual analysis.
-
Perform the 3D visual operation by supplying the analysis object with the necessary parameters. The parameter type (either location or geoelement) should match the type of the analysis object.
-
Add the operation to a new
Analysis, and add theOverlay Analysisto the scene view to display the results.Overlay
The general steps to perform a visual analysis with an ArcGIS Maps SDK for JavaScript are:
-
Create a new JavaScript application and reference the JavaScript API.
-
Create a new scene view in your application and add any additional data layers you would like to include in the analysis.
-
Create a new analysis object either directly or by using a widget.
-
Perform the 3D visual operation by supplying the analysis object with the necessary parameters.
-
Add the operation directly to the scene view
analysesto display the analysis results.
ArcGIS software and tools
You can use the Scene Viewer and ArcGIS Pro to perform 3D visual analyses interactively. The Scene Viewer is an interactive web application that allows you to display 3D scenes and execute visual analysis operations. ArcGIS Pro is a desktop application that runs on Windows devices.
The general steps to perform a visual analysis in ArcGIS Scene Viewer are:
-
Open ArcGIS Scene Viewer in your browser.
-
Sign in using an ArcGIS Online account.
-
Create a new scene (either global or local) or open an existing one.
-
Add any data layers you would like to include in the analysis by going to Add layers. Select a layer hosted in ArcGIS Online or enter the URL of a hosted feature layer.
-
Perform a 3D visual analysis by going to the Analyze menu and selecting an analysis operation. Line of sight analysis is available from the Add layers menu.
-
View the results on the scene view.
The general steps to perform a visual analysis in ArcGIS Pro are:
-
Go to ArcGIS Pro and log in with your ArcGIS account.
-
Create a new scene or open an existing one. Add any data layers that you would like to include in your analysis.
-
Open the Analysis ribbon and select the Exploratory 3D Analysis menu.
-
Select a 3D visual operation, set the parameters, and execute the analysis.
-
View the results on the scene view.
4. Display the results
You can display the results of a 3D visual analysis with a scene view.
If you are using Scene Viewer, analysis results automatically display on the scene through a graphics layer. You can mange the visibility of line of sight results in the Layers tab.
If you are using the ArcGIS Maps SDK for JavaScript, you add analysis results to a scene view's analyses to display them as an analysis view.
If you are using an Native SDK, you add the results to an Analysis to display them in the scene. To display analysis results, add the Analysis to the scene view.
Example
This example displays the results of a line of sight analysis. To learn more go to Line of sight.
viewModel.observer = new Point({
latitude: 37.7462,
longitude: -119.5743,
z: 1300
});
viewModel.targets = [
createTarget(37.7339, -119.6377, 2300), // El capitan
createTarget(37.7459, -119.5332, 2700), // Half dome
createTarget(37.7130, -119.6046, 2300), // Taft point
createTarget(37.7566, -119.5969, 2250), // Yosemite falls
createTarget(37.7569, -119.5599, 2300), // North dome
createTarget(37.7677, -119.4894, 2800), // Clouds rest
createTarget(37.7230, -119.5843, 2450), // Sentinel Dome
createTarget(37.7248, -119.5333, 1800) // Nevada falls
];
function createTarget(lat, lon, z) {
return {
location: new Point({
latitude: lat,
longitude: lon,
z: z || 0
})
};
}
Tutorials
Display a viewshed
Perform and display a viewshed analysis in a 3D scene.
Display a line of sight
Perform and display a line of sight analysis in a 3D scene.
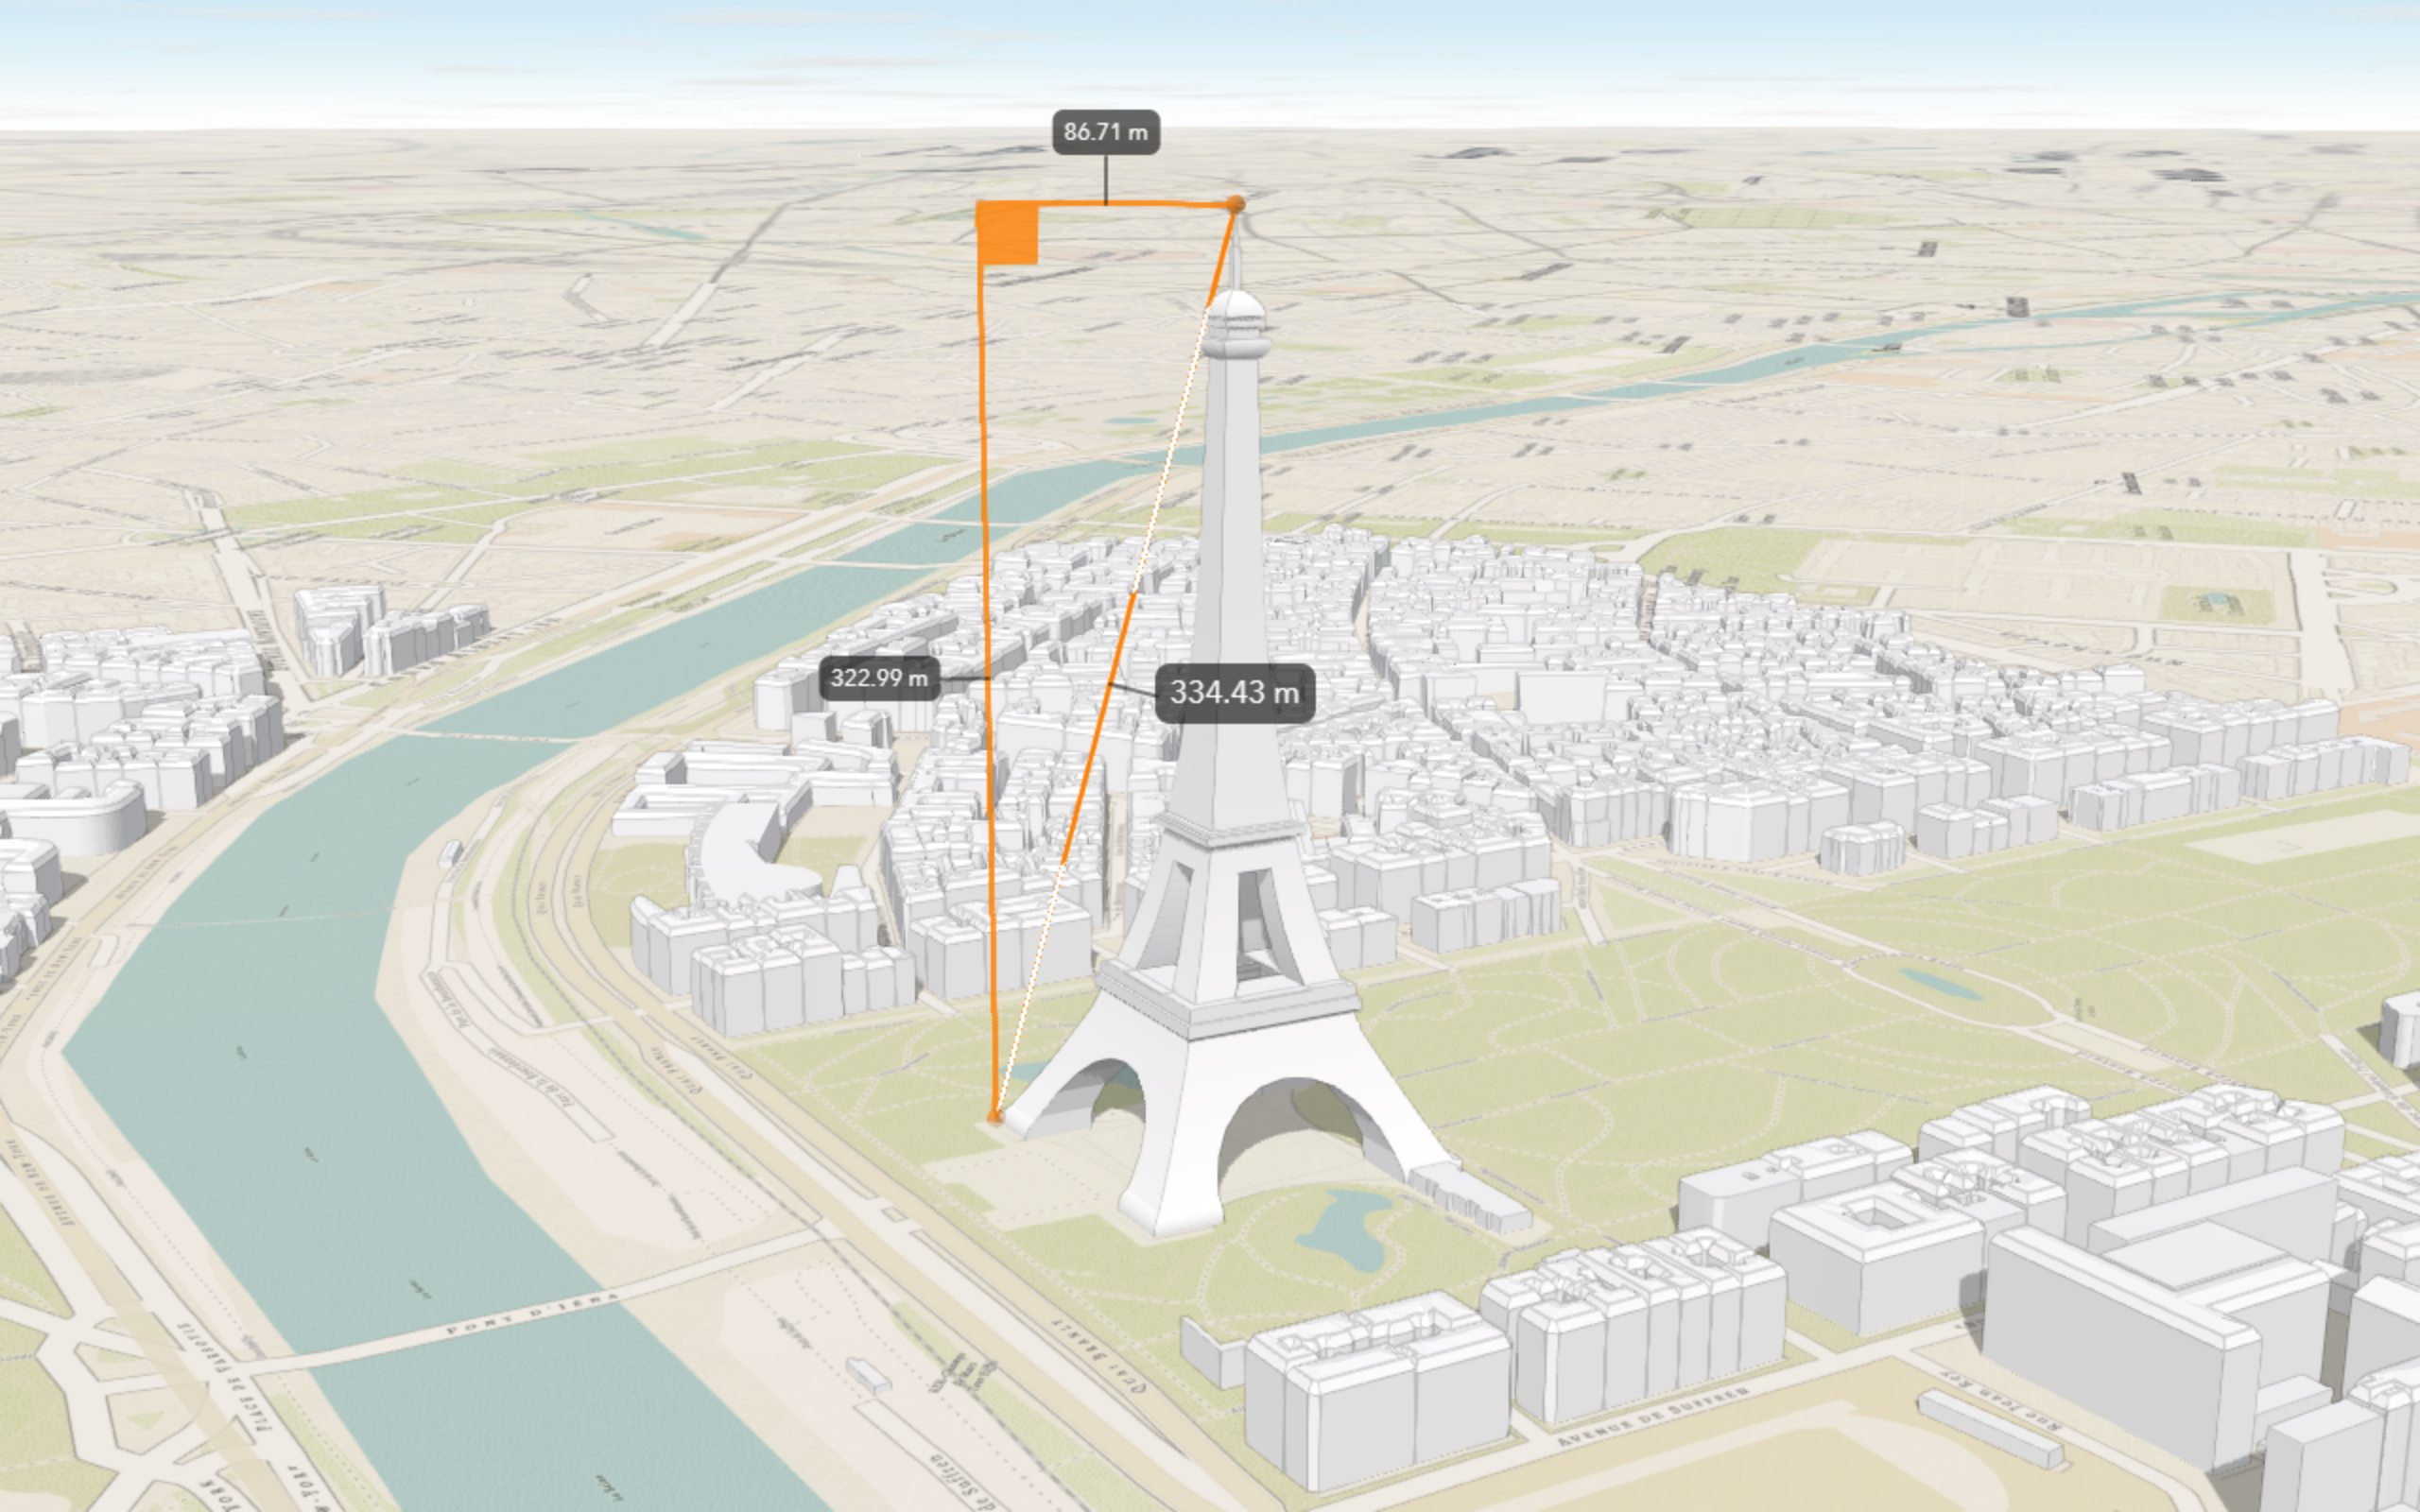
Measure a distance in 3D
Evaluate the horizontal, vertical, and direct distances between two points in a 3D scene.
API support
| Viewshed analysis | Line of sight analysis | Distance measurement | Area measurement | |
|---|---|---|---|---|
| ArcGIS Maps SDK for JavaScript | 1 | 2 | ||
| ArcGIS Maps SDK for .NET | ||||
| ArcGIS Maps SDK for Kotlin | ||||
| ArcGIS Maps SDK for Swift | ||||
| ArcGIS Maps SDK for Java | ||||
| ArcGIS Maps SDK for Qt | ||||
| ArcGIS API for Python | ||||
| ArcGIS REST JS | ||||
| Esri Leaflet | ||||
| MapBox GL JS | ||||
| OpenLayers |
- 1. Access with geoprocessing task
- 2. Supports point location line of sight
Tool support
| Viewshed analysis | Line of sight analysis | Distance measurement | Area measurement | |
|---|---|---|---|---|
| ArcGIS Pro | ||||
| ArcGIS Scene Viewer |