Learn how to add demographic and local facts data to hosted feature layers using the Map Viewer, ArcGIS APIs, and the GeoEnrichment service.
GeoEnrichment is the process of discovering and adding demographic and local facts data to feature data. To enrich data, you choose from thousands of data variables grouped into categories such as population, age, income, housing, and spending, and then use the Map Viewer, GeoEnrichment service, or spatial analysis service to enrich the data. The additional data can be used to reveal demographic, socioeconomic, and other financial and business-related patterns for a geographic area.
In this tutorial, you use the Map Viewer, ArcGIS API for Python, ArcGIS REST JS, and the ArcGIS REST API to add demographic information to hosted feature layers using the Enrich operation from the spatial analysis service.
Prerequisites
Steps
The easiest way to enrich data is to use the Map Viewer. The main requirement is that you have a hosted feature layer available to perform the enrichment analysis.
The general steps to use the Map Viewer include the following:
- Go to Map Viewer and sign in with your ArcGIS Online account.
- In the top bar, click Add to select and add the hosted feature layers that you want to enrich.
- Click Analysis > Data Enrichment > Enrich Layer.
- In the dropdown, select the analysis layer to enrich.
- Click Select Variables to select the data variables you want and then click Apply.
- Specify a Result layer name > Run Analysis.
- View the results on the map.
Code examples
The examples below show you how to enrich different types of hosted feature layers with different data variables. The analysis ranges from country to city scale.
Enrich countries with population data
In this example, you add population data to countries in the World Countries (Generalized) hosted feature layer. The data variable used is Total Population.
Steps
- Go to the Map Viewer and sign in with your ArcGIS Online account.
- In the top bar, click Add > Browse Living Atlas Layers and type the following:
World Countries (Generalized). - Select the layer > Add to Map.
- Ensure that the layer is checked and is visible on the map.
- In the top bar, click Analysis > Data Enrichment > Enrich Layer.
- Set the following parameters:
- Choose layer to enrich with new data: World Countries (Generalized).
- Click Select Variables > Population > Show all Population Variables > Key Demographic Indicators.
- Select Total Population.
- Click Apply.
- Set the Result layer name to:
Enriched World Countries. - Uncheck Use current map extent so that all features are included in the analysis.
- Click Show credits. The analysis will consume approximately USD $0.251 (2.51 credits).
- Click Run Analysis.
- Implement user authentication to access the spatial analysis service.
- Define the parameters of the request.
- Execute the operation. Note: This is a long transaction managed with a job request.
- Handle the results.
APIs
inputLayer = "https://services.arcgis.com/P3ePLMYs2RVChkJx/arcgis/rest/services/World_Countries_(Generalized)/FeatureServer/0"
results = enrich_layer(
input_layer=inputLayer,
analysis_variables=["KeyGlobalFacts.TOTPOP"],
output_name="Enriched world countries", # Outputs results as a hosted feature layer
)
print(f"New item created : {results.itemid}")Service requests
Request
POST arcgis.com/sharing/rest/portals/self HTTP/1.1
Content-Type: application/x-www-form-urlencoded
&f=json
&token=<ACCESS_TOKEN>Response (JSON)
{
"helperServices": {
// Other parameters
"analysis": {
"url": "https://<YOUR_ANALYSIS_SERVICE>/arcgis/rest/services/tasks/GPServer"
},
"geoenrichment": {
"url": "https://geoenrich.arcgis.com/arcgis/rest/services/World/GeoenrichmentServer"
}
}
}Request
POST /arcgis/rest/services/tasks/GPServer/EnrichLayer/submitJob HTTP/1.1
Content-Type: application/x-www-form-urlencoded
f=json
&token=<ACCESS_TOKEN>
&inputLayer={"url":"https://services.arcgis.com/P3ePLMYs2RVChkJx/arcgis/rest/services/World_Countries_(Generalized)/FeatureServer/0"}
&analysisVariables=["KeyGlobalFacts.TOTPOP"]
&outputName={"serviceProperties":"name":{"Enrich layers result"}}
Response (JSON)
{
"jobId": "<JOB_ID>",
"jobStatus": "esriJobSubmitted",
"results": {},
"inputs": {},
"messages": []
}
Request
POST /arcgis/rest/services/tasks/GPServer/EnrichLayer/submitJob/jobs/<JOB_ID> HTTP/1.1
Content-Type: application/x-www-form-urlencoded
f=json
&token=<ACCESS_TOKEN>
Response (JSON)
// Executing job
{
"jobId": "<JOB_ID>",
"jobStatus": "esriJobExecuting",
"results": {},
"inputs": {},
"messages": []
}
// Job succeeded
{
"jobId": "<JOB_ID>",
"jobStatus": "esriJobSucceeded",
"results": {
"enrichedLayer": {
"paramUrl": "results/enrichedLayer"
}
},
"inputs": {},
"messages": []
}
Request
POST /arcgis/rest/services/tasks/GPServer/EnrichLayer/submitJob/jobs/<JOB_ID>/results/enrichedLayer HTTP/1.1
Content-Type: application/x-www-form-urlencoded
f=json
&token=<ACCESS_TOKEN>Response (JSON)
{
"paramName": "enrichedLayer",
"dataType": "GPString",
"value": {
"url": "<SERVICE_URL>",
"itemId": "<ITEM_ID>"
}
}Results
The results are returned in a new hosted feature layer containing 251 country boundary polygons enriched with population data.
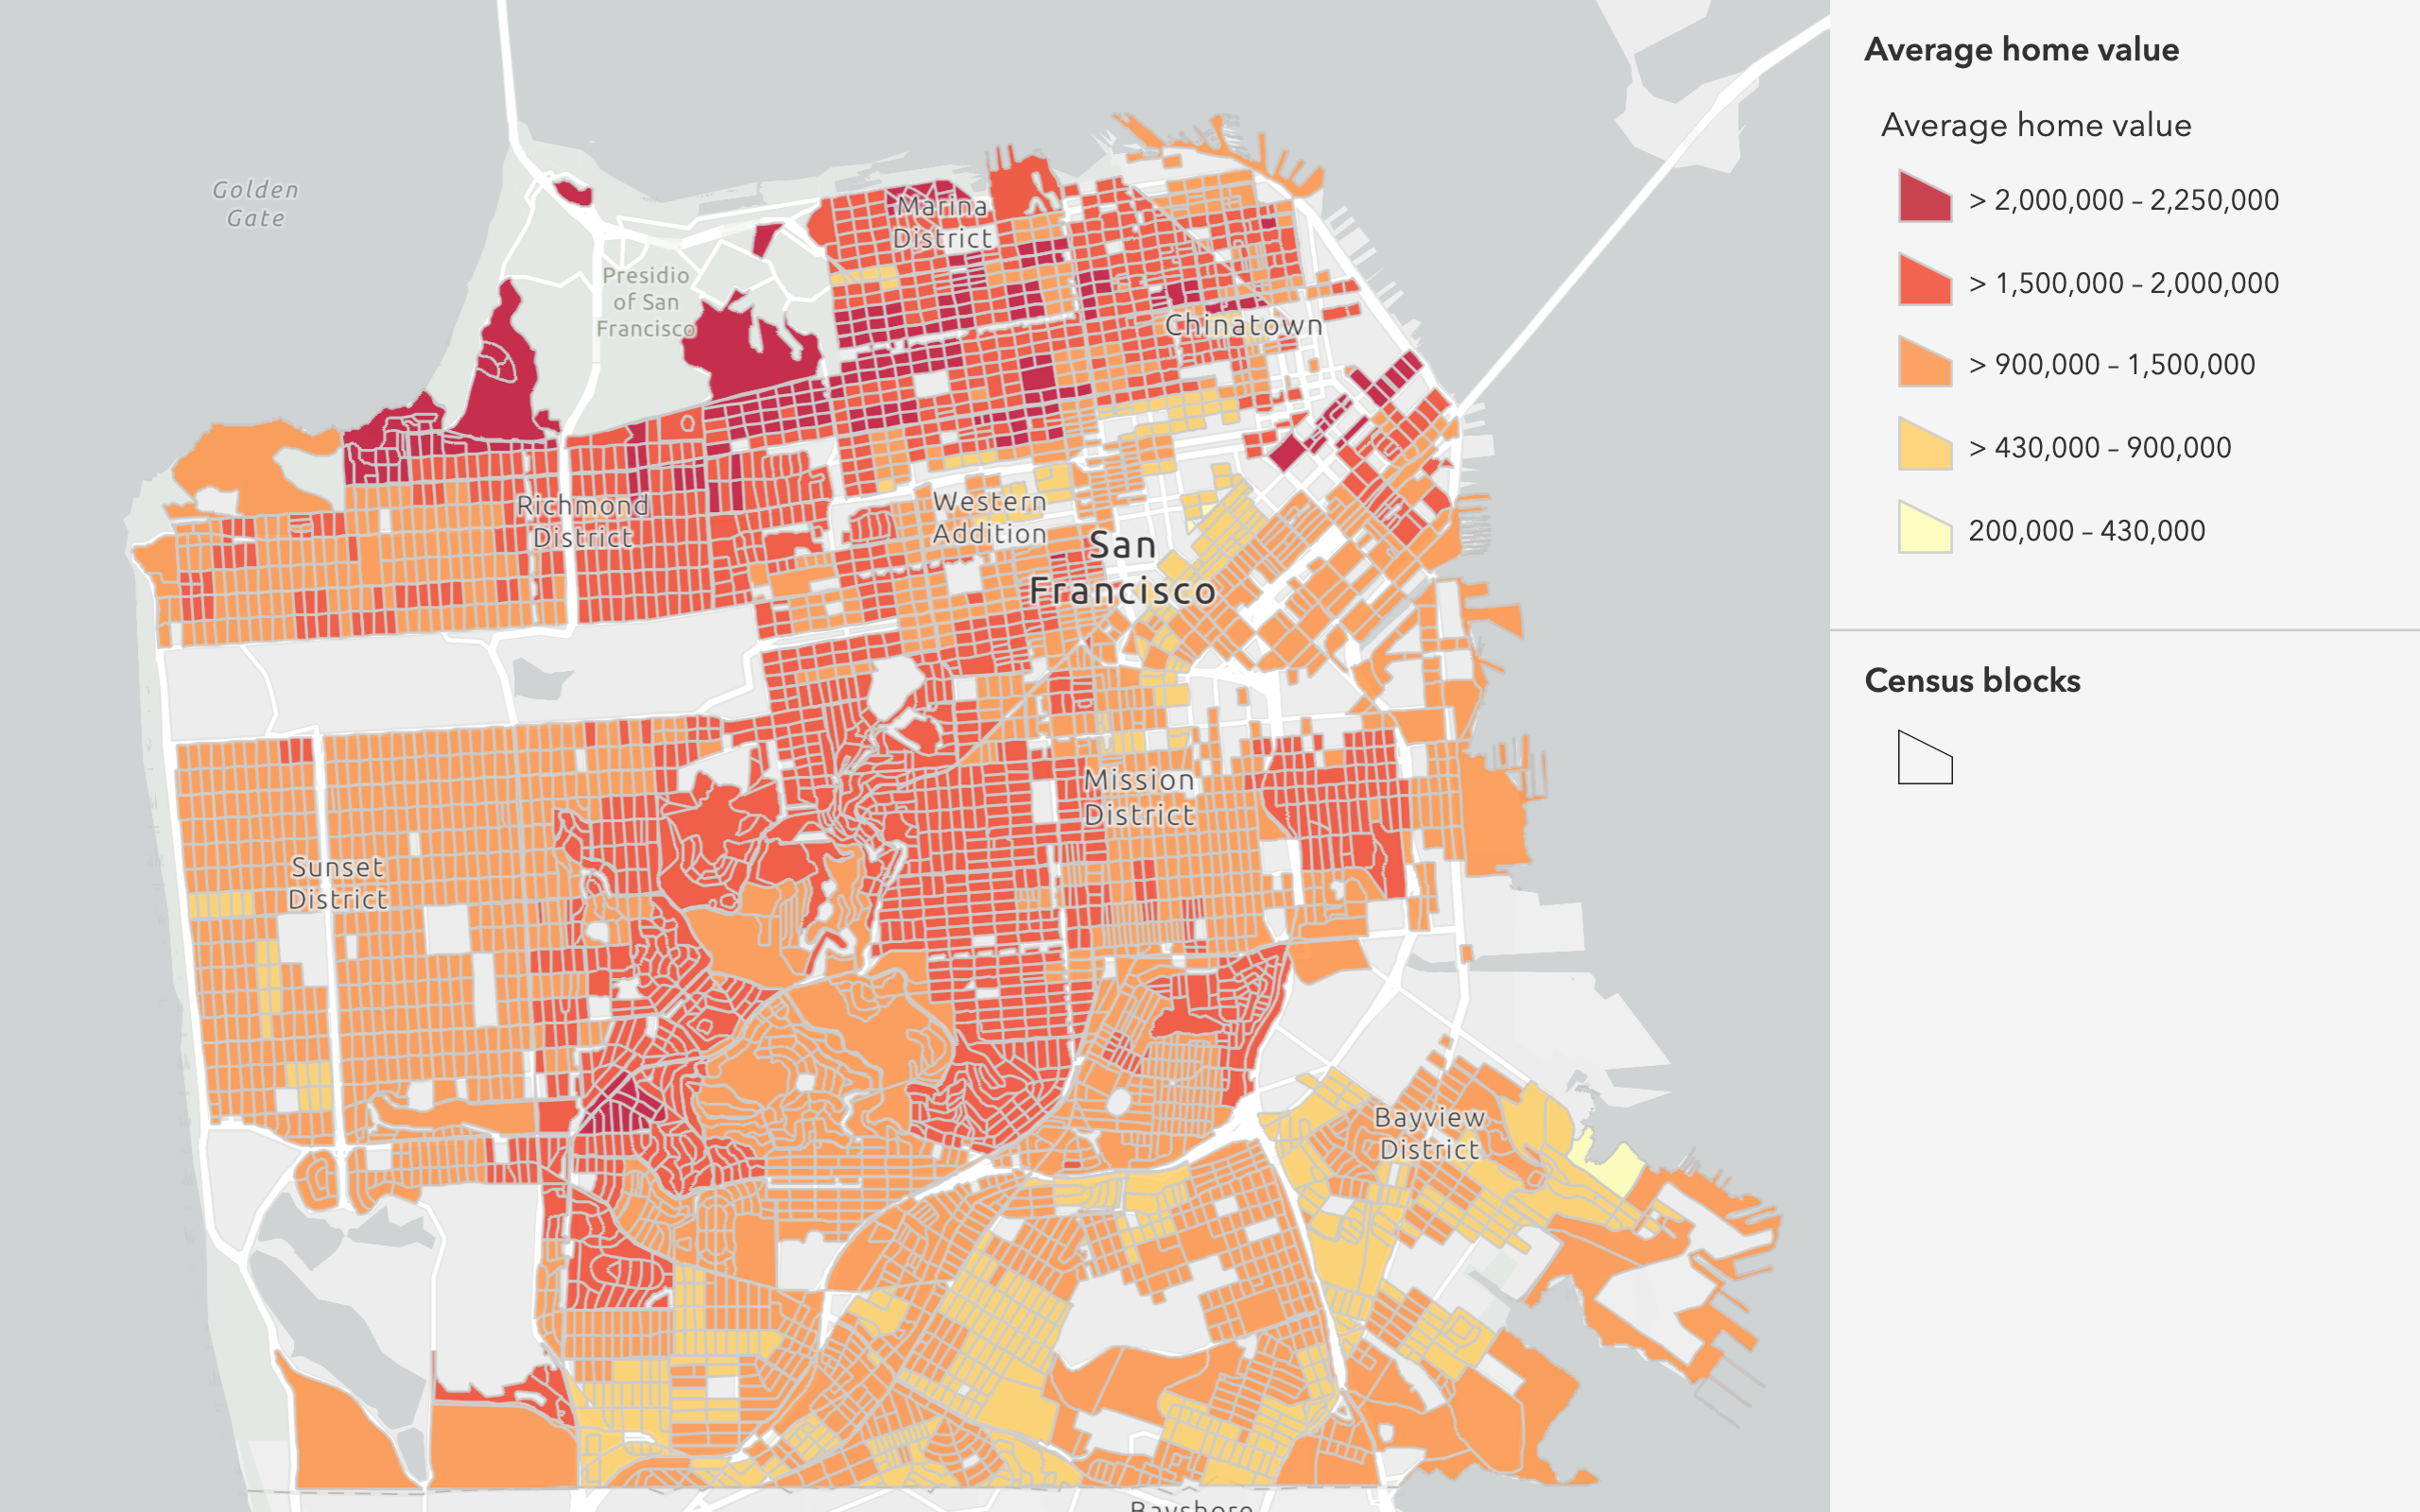
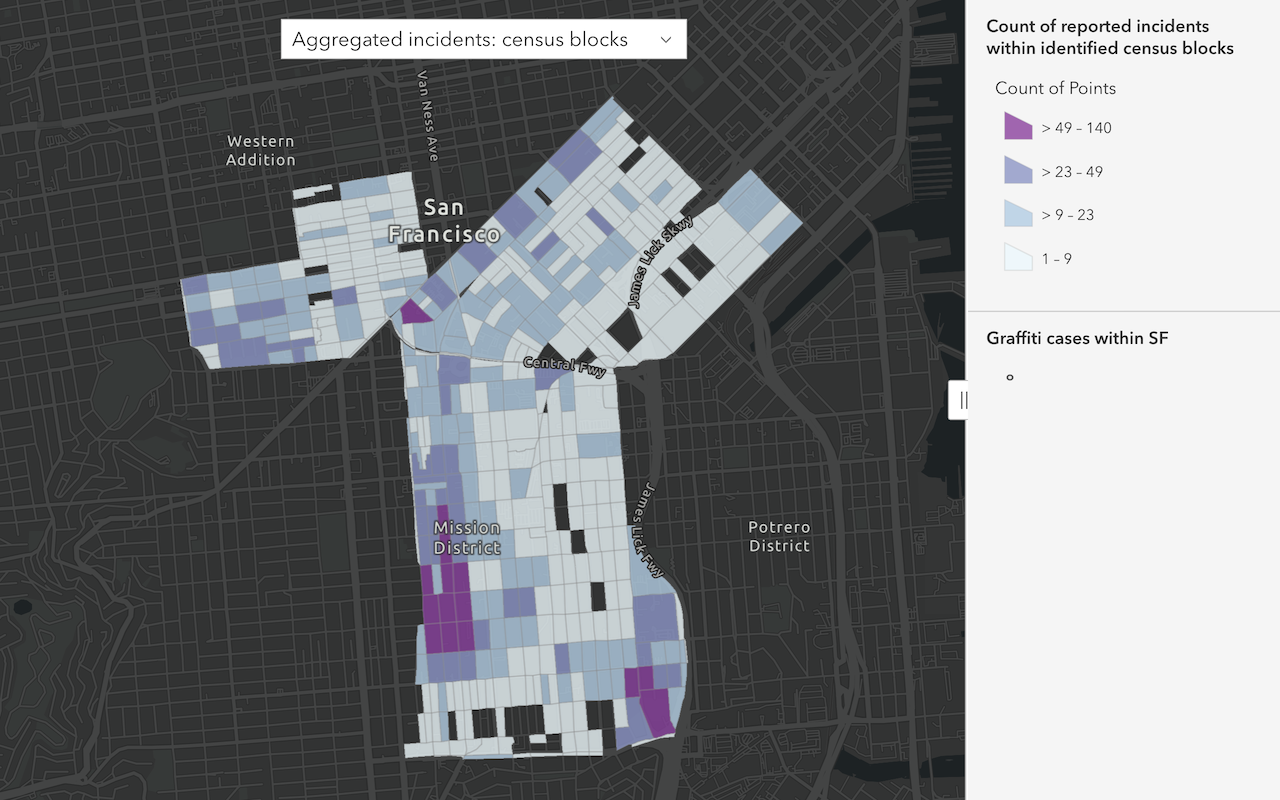
Enrich USA census blocks with housing data
In this example, you add housing and household data to the USA Census Block Groups hosted feature layer, provided by the ArcGIS Living Atlas of the World.
The data variables include the following:
2022 Average Home Value2022 Renter Occupied Housing Units2022 Average Household Income (Esri)
Steps
- Go to the Map Viewer and sign in with your ArcGIS Online account.
- In the search bar, type in New Orleans, LA.
- In the top bar, click Add > Browse Living Atlas Layers and type the following:
USA Census Block Groups. - Select the layer > Add to Map.
- Ensure that the layer is checked and is visible on the map.
- In the top bar, click Analysis > Data Enrichment > Enrich Layer.
- Set the following parameters:
- Choose layer to enrich with new data: U.S. Census Block Groups.
- Click Select Variables > Housing > Show all Housing Variables.
- Select the following variables:
- 2022 Average Home Value
- 2022 Renter Occupied Housing Units
- 2022 Average Household Income (Esri)
- Click Apply.
- Set the Result layer name to:
NOLA enriched census blocks.
- Click Show credits. The analysis will consume approximately USD $2.90 (29 credits).
- Click Run Analysis.
- Implement user authentication to access the spatial analysis service.
- Define the parameters of the request.
- Execute the operation. Note: This is a long transaction managed with a job request.
- Handle the results.
APIs
inputLayer = "https://services2.arcgis.com/FiaPA4ga0iQKduv3/arcgis/rest/services/USA_Block_Groups_v1/FeatureServer/0"
results = enrich_layer(
input_layer=inputLayer,
analysis_variables=[
"homevalue.AVGVAL_CY",
"KeyUSFacts.RENTER_CY",
"AtRisk.AVGHINC_CY",
],
country="US",
context={
"extent": {
"xmin": -10064584.78182423,
"ymin": 3469864.993711926,
"xmax": -10005269.647874909,
"ymax": 3535218.6528957766,
"spatialReference": {"wkid": 102100, "latestWkid": 3857},
}
},
output_name="Enrich layers census block results", # Outputs results as a hosted feature layer
)
print(f"New item created : {results.itemid}")Service requests
Request
POST arcgis.com/sharing/rest/portals/self HTTP/1.1
Content-Type: application/x-www-form-urlencoded
&f=json
&token=<ACCESS_TOKEN>Response (JSON)
{
"helperServices": {
// Other parameters
"analysis": {
"url": "https://<YOUR_ANALYSIS_SERVICE>/arcgis/rest/services/tasks/GPServer"
},
"geoenrichment": {
"url": "https://geoenrich.arcgis.com/arcgis/rest/services/World/GeoenrichmentServer"
}
}
}Request
POST /arcgis/rest/services/tasks/GPServer/EnrichLayer/submitJob HTTP/1.1
Content-Type: application/x-www-form-urlencoded
f=json
&token=<ACCESS_TOKEN>
&inputLayer={"url":"https://services2.arcgis.com/FiaPA4ga0iQKduv3/arcgis/rest/services/USA_Block_Groups_v1/FeatureServer/0"}
&analysisVariables=["homevalue.AVGVAL_CY","KeyUSFacts.RENTER_CY","AtRisk.AVGHINC_CY"]
&country=US
&context={"extent": {"xmin": -10064584.78182423,"ymin": 3469864.993711926,"xmax": -10005269.647874909,"ymax": 3535218.6528957766,"spatialReference": {"wkid": 102100, "latestWkid": 3857}}}
&outputName={"serviceProperties":"name":{"Enrich layers result"}}
Response (JSON)
{
"jobId": "<JOB_ID>",
"jobStatus": "esriJobSubmitted",
"results": {},
"inputs": {},
"messages": []
}
Request
POST /arcgis/rest/services/tasks/GPServer/EnrichLayer/submitJob/jobs/<JOB_ID> HTTP/1.1
Content-Type: application/x-www-form-urlencoded
f=json
&token=<ACCESS_TOKEN>
Response (JSON)
// Executing job
{
"jobId": "<JOB_ID>",
"jobStatus": "esriJobExecuting",
"results": {},
"inputs": {},
"messages": []
}
// Job succeeded
{
"jobId": "<JOB_ID>",
"jobStatus": "esriJobSucceeded",
"results": {
"enrichedLayer": {
"paramUrl": "results/enrichedLayer"
}
},
"inputs": {},
"messages": []
}
Request
POST /arcgis/rest/services/tasks/GPServer/EnrichLayer/submitJob/jobs/<JOB_ID>/results/enrichedLayer HTTP/1.1
Content-Type: application/x-www-form-urlencoded
f=json
&token=<ACCESS_TOKEN>Response (JSON)
{
"paramName": "enrichedLayer",
"dataType": "GPString",
"value": {
"url": "<SERVICE_URL>",
"itemId": "<ITEM_ID>"
}
}Results
The results are returned in a new hosted feature layer containing census blocks enriched with the housing data.
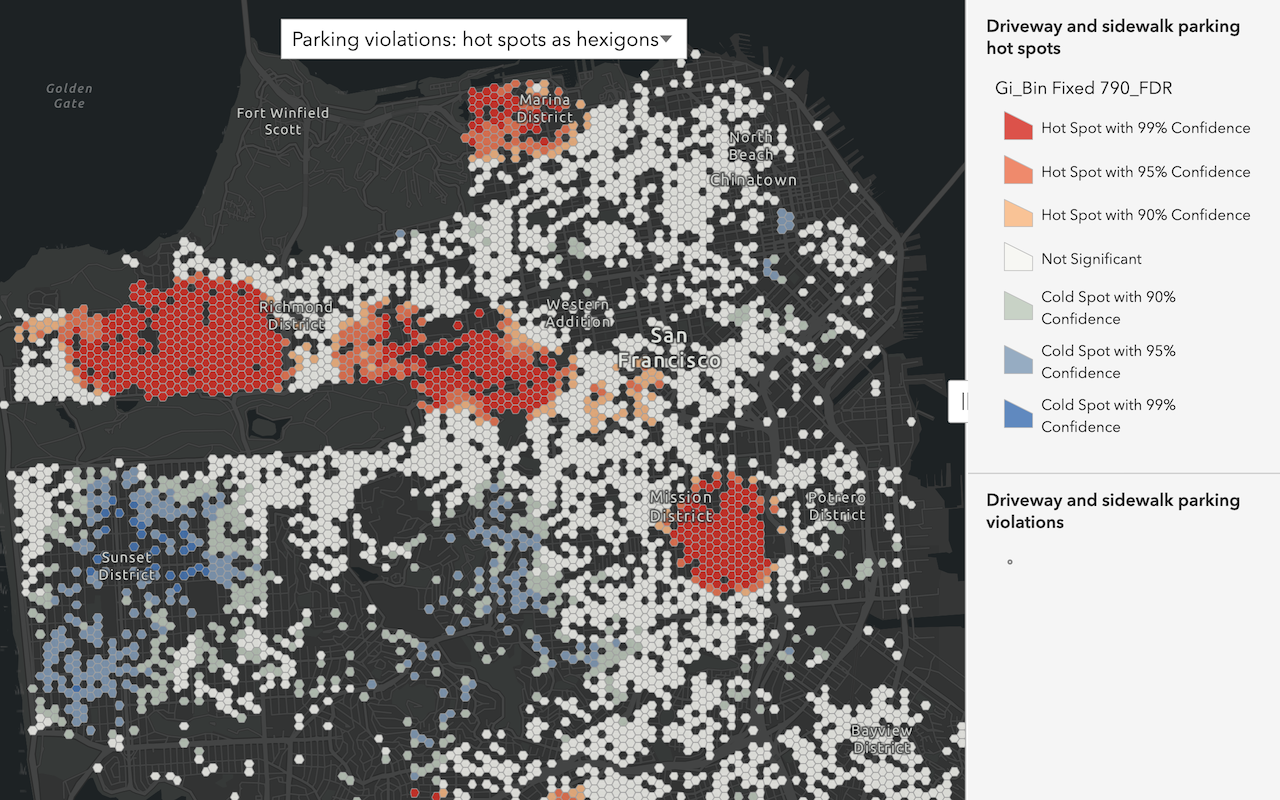
Enrich tessellations with local business data
In this tutorial, you add local business data related to coffee consumers and spending within the Portland City Boundary hosted feature layer. This data could be used to find the areas best suited to support a new coffee bean roasting business.
To subdivide areas within the Portland City Boundary, you will create a hexagon bin tessellation. After creation, you will enrich the bins with coffee consumer and spending information. The data variables you will use are:
2022 Coffee:(average spending)Average 2022 HH Spent $100-$149 in Average Week at Food Stores2022 Shopped at Costco Warehouse or Club Store Last 6 Mo2022 Shopped at Walmart Neighborhood Market Grocery Store Last 6 Mo
Steps
Part 1: Copy the web map
- Go to the Enrich data tutorial web map and click Sign in.
- Verify that you the following layer by toggling the visibility on and off.
- Portland Boundary
- Click Save > Save As > Save Map to save a copy.
Part 2: Generate hexagon bins
- In the top bar, click Analysis > Manage Data > Generate Tessellations.
- Set the following parameters:
- Choose shape: Hexagon
- Define extent: Portland boundary.
- Check Only keep intersecting tessellations.
- Define bin size by specifying:
- Select Distance.
- Enter
1and select Miles.
- Set the Result layer name to:
Portland one mile hexbins. - Click Show credits. The analysis will consume approximately USD $.0352 (.352 credits).
- Click Run Analysis.
- Implement user authentication to access the spatial analysis service.
- Define the parameters of the request.
- Execute the operation. Note: This is a long transaction managed with a job request.
- Handle the results.
APIs
results = generate_tessellation(
bin_size=1,
bin_type="HEXAGON",
bin_size_unit="Miles",
intersect_study_area=True,
extent_layer="https://services3.arcgis.com/GVgbJbqm8hXASVYi/arcgis/rest/services/Boundary/FeatureServer/0",
# Outputs results as a hosted feature service.
output_name="Generate tessellation results",
)
Service requests
Request
POST arcgis.com/sharing/rest/portals/self HTTP/1.1
Content-Type: application/x-www-form-urlencoded
&f=json
&token=<ACCESS_TOKEN>Response (JSON)
{
"helperServices": {
// Other parameters
"analysis": {
"url": "https://<YOUR_ANALYSIS_SERVICE>/arcgis/rest/services/tasks/GPServer"
},
"geoenrichment": {
"url": "https://geoenrich.arcgis.com/arcgis/rest/services/World/GeoenrichmentServer"
}
}
}Request
POST <YOUR_ANALYSIS_SERVICE>/arcgis/rest/services/tasks/GPServer/GenerateTessellations/submitJob HTTP/1.1
Content-Type: application/x-www-form-urlencoded
&f=json
&token=<ACCESS_TOKEN>
&binType=HEXAGON
&extentLayer={"url":"https://services3.arcgis.com/GVgbJbqm8hXASVYi/arcgis/rest/services/Boundary/FeatureServer/0","name":"Boundary"}
&intersectStudyArea=true
&binSize=1
&binSizeUnit=Miles
&outputName={"serviceProperties":{"name":"Generate tessellations results"}}
Response (JSON)
{
"jobId": "<JOB_ID>",
"jobStatus": "esriJobSubmitted",
"results": {},
"inputs": {},
"messages": []
}
Request
POST <YOUR_ANALYSIS_SERVICE>/arcgis/rest/services/tasks/GPServer/GenerateTessellations/jobs/<JOB_ID> HTTP/1.1
Content-Type: application/x-www-form-urlencoded
&f=json
&token=<ACCESS_TOKEN>
Response (JSON)
// Executing job
{
"jobId": "<JOB_ID>",
"jobStatus": "esriJobExecuting",
"results": {},
"inputs": {},
"messages": []
}
// Job succeeded
{
"jobId": "<JOB_ID>",
"jobStatus": "esriJobSucceeded",
"results": {
"tessellationLayer": {
"paramUrl": "results/tessellationLayer"
},
},
"inputs": {},
"messages": []
}
Request
POST <YOUR_ANALYSIS_SERVICE>/arcgis/rest/services/tasks/GPServer/GenerateTessellations/jobs/<JOB_ID>/results/tessellationLayer HTTP/1.1
Content-Type: application/x-www-form-urlencoded
&f=json
&returnType=data
&token=<ACCESS_TOKEN>Response (JSON)
{
"paramName": "tessellationLayer",
"dataType": "GPString",
"value": {
"url": "<SERVICE_URL>",
"itemId": "<ITEM_ID>"
}
}The result is a new hosted feature layer that contains hexagon bins (polygons) for Portland.
Part 3: Enrich the hexagon bins
- In the top bar, click Analysis > Data Enrichment > Enrich Layer.
- Set the following parameters:
- Choose layer to enrich with new data: Portland one mile hexbins.
- Click Select Variables.
- In the search box, enter and select the following variables:
2022 Coffee:Average 2022 HH Spent $100-$149 in Average Week at Food Stores2022 Shopped at Costco Warehouse or Club Store Last 6 Mo.2022 Shopped at Walmart Neighborhood Market Grocery Store Last 6 Mo.
- Click Apply.
- Set the Result layer name to:
Portland - Enriched hexbins. - Click Show credits. The analysis will consume approximately USD $.0812 (8.12 credits).
- Click Run Analysis.
- Implement user authentication to access the spatial analysis service.
- Define the parameters of the request.
- Execute the operation. Note: This is a long transaction managed with a job request.
- Handle the results.
APIs
results = enrich_layer(
input_layer="<Generate tessellations results URL>",
analysis_variables=[
"food.X1122_A",
"GroceryAlcoholicBeverages.MP13002H_B",
"GroceryAlcoholicBeverages.MP13026A_B",
"GroceryAlcoholicBeverages.MP13030A_B",
],
output_name="Enriched one mile hexbin results", # Outputs results as a hosted feature layer
)
print(f"New item created : {results.itemid}")Service requests
Request
POST arcgis.com/sharing/rest/portals/self HTTP/1.1
Content-Type: application/x-www-form-urlencoded
&f=json
&token=<ACCESS_TOKEN>Response (JSON)
{
"helperServices": {
// Other parameters
"analysis": {
"url": "https://<YOUR_ANALYSIS_SERVICE>/arcgis/rest/services/tasks/GPServer"
},
"geoenrichment": {
"url": "https://geoenrich.arcgis.com/arcgis/rest/services/World/GeoenrichmentServer"
}
}
}Request
POST /arcgis/rest/services/tasks/GPServer/EnrichLayer/submitJob HTTP/1.1
Content-Type: application/x-www-form-urlencoded
f=json
&token=<ACCESS_TOKEN>
&inputLayer={"url":"<Generate tessellations results URL>"}
&analysisVariables=["food.X1122_A","GroceryAlcoholicBeverages.MP13002H_B","GroceryAlcoholicBeverages.MP13026A_B","GroceryAlcoholicBeverages.MP13030A_B"]
&outputName={"serviceProperties":"name":{"Enrich layers result"}}
Response (JSON)
{
"jobId": "<JOB_ID>",
"jobStatus": "esriJobSubmitted",
"results": {},
"inputs": {},
"messages": []
}
Request
POST /arcgis/rest/services/tasks/GPServer/EnrichLayer/submitJob/jobs/<JOB_ID> HTTP/1.1
Content-Type: application/x-www-form-urlencoded
f=json
&token=<ACCESS_TOKEN>
Response (JSON)
// Executing job
{
"jobId": "<JOB_ID>",
"jobStatus": "esriJobExecuting",
"results": {},
"inputs": {},
"messages": []
}
// Job succeeded
{
"jobId": "<JOB_ID>",
"jobStatus": "esriJobSucceeded",
"results": {
"enrichedLayer": {
"paramUrl": "results/enrichedLayer"
}
},
"inputs": {},
"messages": []
}
Request
POST /arcgis/rest/services/tasks/GPServer/EnrichLayer/submitJob/jobs/<JOB_ID>/results/enrichedLayer HTTP/1.1
Content-Type: application/x-www-form-urlencoded
f=json
&token=<ACCESS_TOKEN>Response (JSON)
{
"paramName": "enrichedLayer",
"dataType": "GPString",
"value": {
"url": "<SERVICE_URL>",
"itemId": "<ITEM_ID>"
}
}Results
The result is a new hosted feature layer containing 203 hexagons enriched with consumer spending data.
What's next?
Learn how to use additional tools, APIs, and location services in these tutorials:
Create data sources
Import, create, and generate data for feature analysis.
Find data sources
Discover data in ArcGIS that you can use for feature analysis.
Find and extract data
Find data with attribute and spatial queries using find analysis operations.
Combine data
Overlay, join, and dissolve features using combine analysis operations.
Summarize data
Aggregate and summarize features using summarize analysis operations.
Discover patterns in data
Find patterns and trends in data using spatial analysis operations.
Perform a feature analysis
Perform a feature analysis using ArcGIS REST JS.