The general steps to get demographic data and facts from the GeoEnrichment service are:
1. Define a study area
The first step it to define one or more study areas. A study area is a location used for spatial analysis in the GeoEnrichment service. The study parameter is required to make a request to the service. When you submit a request, the service returns information for the study areas provided.
Types of study areas
The value of the study parameter can take many forms. It can include one or more point, line, or polygon geometries, administrative boundaries, street addresses, and drive time service areas. For points and addresses, the GeoEnrichment service calculates a buffer or service area in which to aggregate data. See the examples below:
| Study area | Description | Example |
|---|---|---|
| Named administrative boundaries | Includes countries, states, U.S. ZIP Codes, etc | study |
| Street addresses | Defaults to a one mile buffer around address | study |
| Buffer around a point or line | Defaults to a one mile buffer around point or line | study |
| Area within a polygon | Area within a geometry defined by three or more points. | study |
| Drive time service areas | Calculates a drive time area around a point or address | study |
2. Specify the data to find
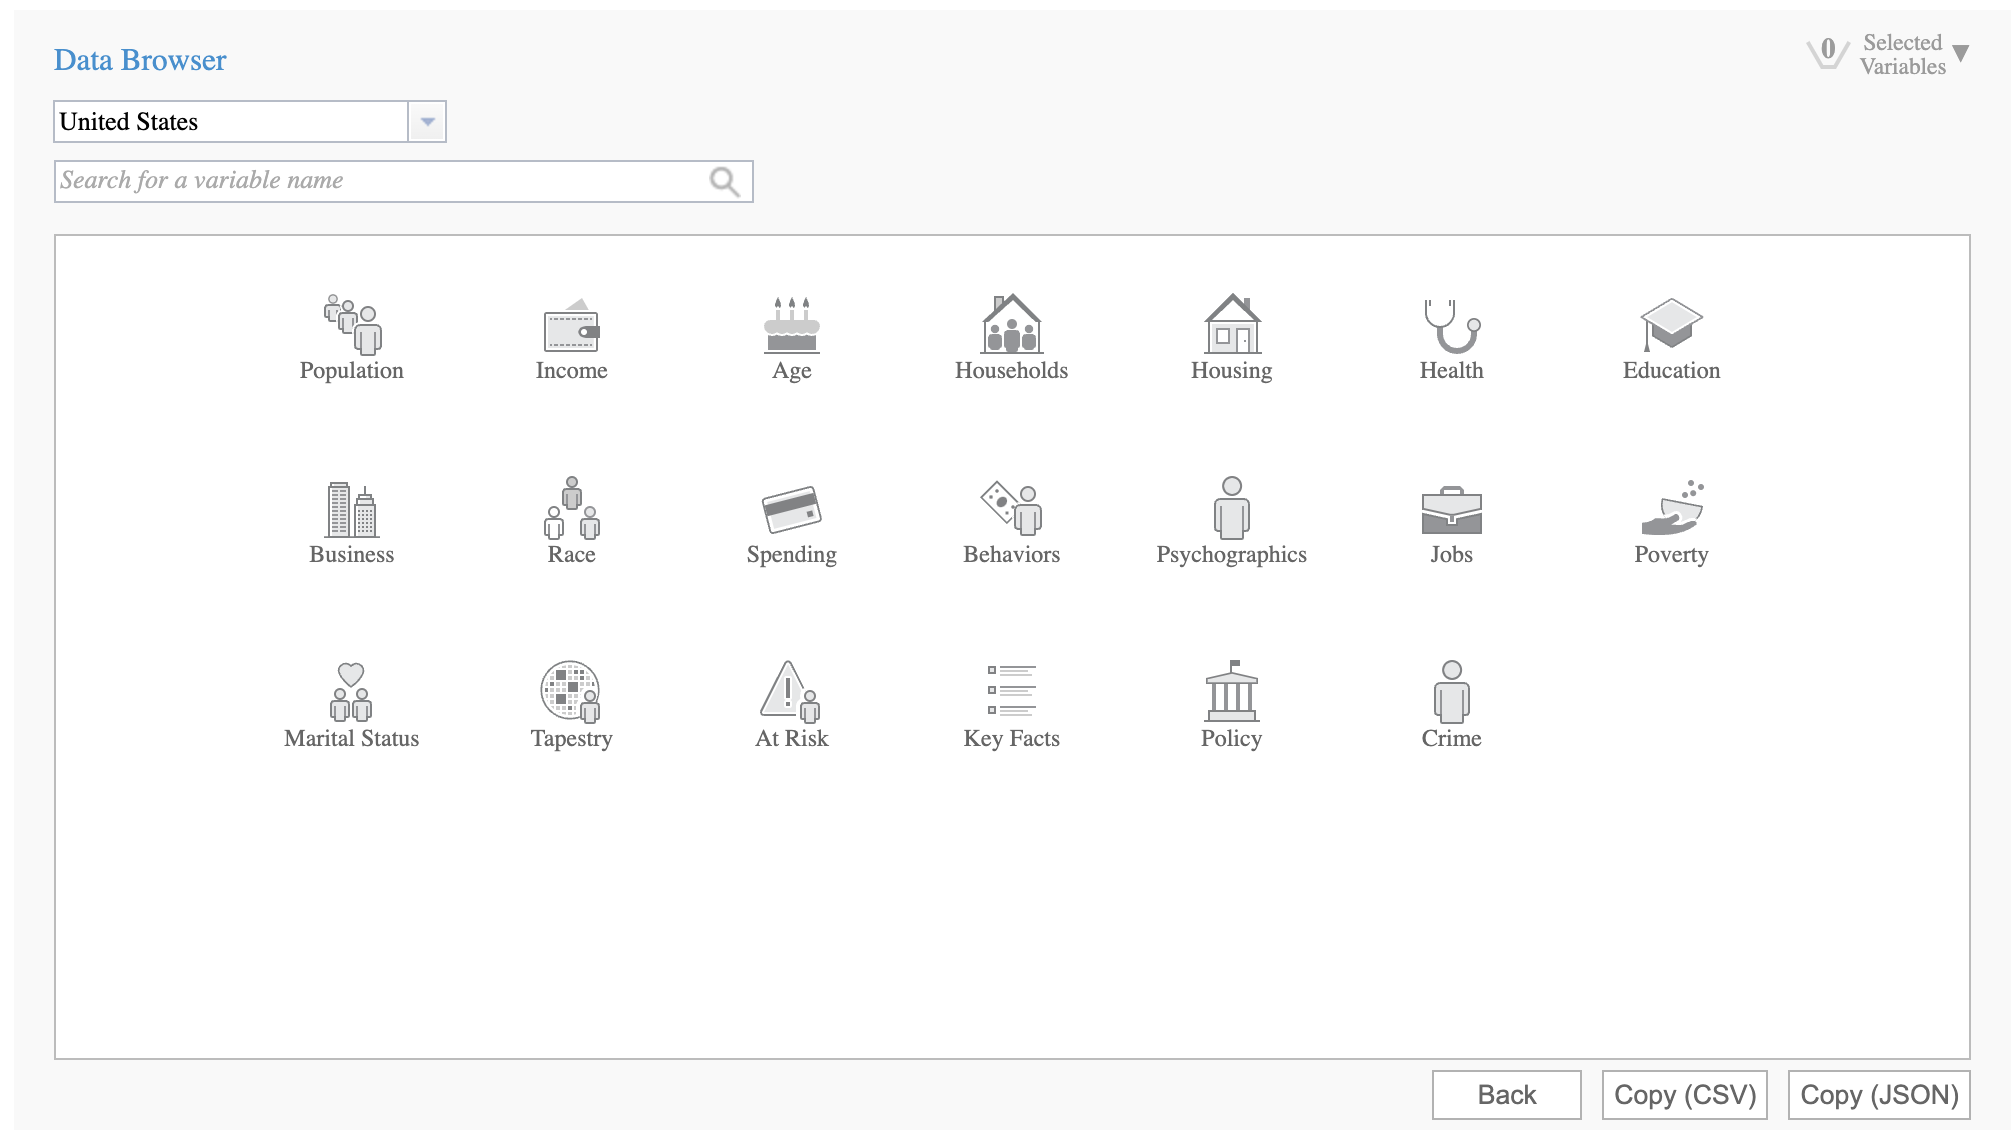
To get data for a study area, you need to find the analysis variable and/or data collection names you need to use to get the data you want from the GeoEnrichment service. There are thousands of data variables and collections to choose from. You can query the service for these values or you can find them interactively with the Analysis Variable Finder and Data Collection Finder.
Analysis variables
An analysis variable is a parameter that represents data stored within the GeoEnrichment service. All valid enrich queries to the GeoEnrichment service return analysis variables in their response.
You can set the analysis parameter of an enrich request to return global and local data for a study area.
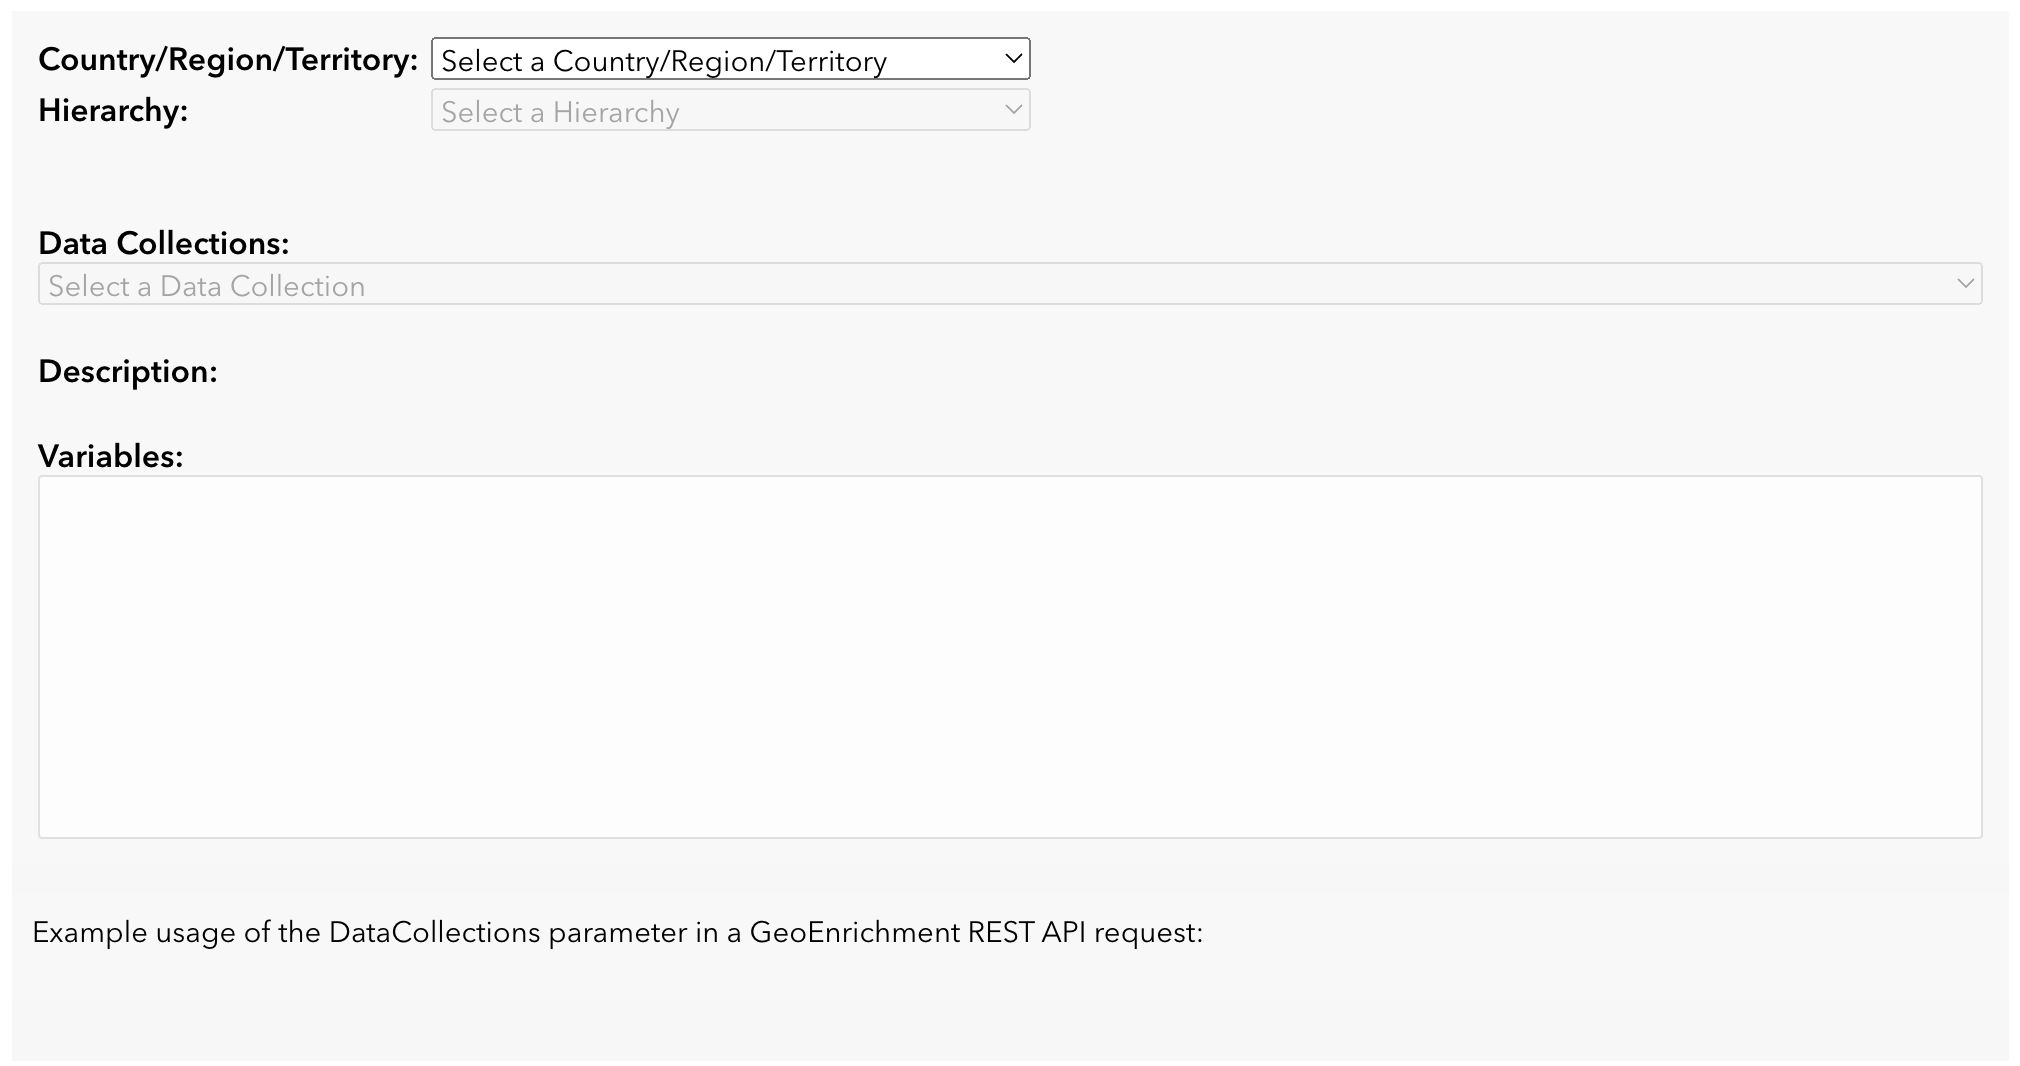
Data collections
A data collection is a predefined list of analysis variables that can be used to get data from the GeoEnrichment service. When you make an enrich request with a data collection, the response contains information for each analysis variable in the collection.
For example, the Key data collection contains the following analysis variables:
Total Population (TOTPOP)Total Households (TOTHH)Average Household Size (AVGHHSZ)Male Population (TOTMALES)Female Population (TOTFEMALES)
3. Make a request
You can use ArcGIS REST JS, ArcGIS API for Python, or the ArcGIS REST API to access the service. Follow the steps below:
ArcGIS APIs
- Import the
geoenrichment,GIS,Geometry, andpandasmodules. - Set your API key or OAuth 2.0 access token.
- Use the
enrichmethod and set the following parameters:study_: The study area in which you want the data returned.areas analysis_orvariables data_. If you provide neither parameter, data from thecollections Keydata collection will be returned by default.Global Facts
Example
from arcgis.geoenrichment import *
from arcgis.geometry import Geometry
from arcgis.gis import GIS
import pandas as pd
def main():
#authenticate with portal using API-KEY
api_key = "YOUR_API_KEY"
portal = GIS("https://www.arcgis.com", api_key=api_key)
#create studyarea of point location
pt = Geometry({"x":-74.0060,"y":40.7128})
#create one-mile radii trade area
buffered = BufferStudyArea(area=pt, radii=[1], units='Miles')
#enrich using householdtotals data collection
result_data_frame = enrich(study_areas=[buffered], data_collections=['educationalattainment'])
#print entire data frame
pd.set_option("display.max_rows", None)
pd.set_option("display.max_colwidth", None)
print(result_data_frame)
if __name__ == "__main__":
main()- Import the
requestanddemographicspackages. - Set the following parameters for the
queryoperation:Demographic Data study: The study area in which you want the data returned.Areas - The
analysisorVariables dataparameter. If you provide neither parameter, data from theCollections Keydata collection will be returned by default.Global Facts authentication: An API key or OAuth 2.0 access token.
Example
const authentication = arcgisRest.ApiKeyManager.fromKey(apiKey);
arcgisRest.queryDemographicData({
studyAreas: [{ "geometry": { "x":-74.0060,"y":40.7128 } }],
authentication: authentication,
dataCollections: ["PopulationTotals"]
})
.then((response) => {
if (response.results[0].value.FeatureSet.length > 0 &&
response.results[0].value.FeatureSet[0].features.length > 0) {
const attributes = response.results[0].value.FeatureSet[0].features[0].attributes;
console.log(`<b>Data for a 1 mile search</b><br>Total Population: ${attributes.TOTPOP_CY}<br>Household Population: ${attributes.HHPOP_CY} <br>Popluation Density (per sq. mile): ${attributes.POPDENS_CY}<br>Population: Annual Growth Rate: ${attributes.POPGRW10CY}<br>Housing Affordability Index: ${attributes.HAI_CY}`);
} else {
console.log("No data found.");
}
});ArcGIS REST API
- Construct a
GETorPOSTrequest. - Set the following parameters:
study: The study area in which you want the data returned.Areas - The
analysisorVariables data. If you provide neither parameter, data from theCollections Keydata collection will be returned by default.Global Facts token: An API key or OAuth 2.0 access token.
- Send the request.
Example
This example returns data from the educationalattainment data collection in a 1-mile buffer around a point.
curl https://geoenrich.arcgis.com/arcgis/rest/services/World/geoenrichmentserver/Geoenrichment/enrich? \
-d "studyAreas=[{'geometry':{'x': -74.0060, 'y': 40.7128}}]" \
-d "dataCollections=[educationalattainment]" \
-d "f=json" \
-d "token=<ACCESS_TOKEN>"{
"results" : [ {
"paramName" : "GeoEnrichmentResult",
"dataType" : "GeoEnrichmentResult",
"value" : {
"version" : "2.0",
"FeatureSet" : [ {
"displayFieldName" : "",
"fieldAliases" : {
"ID" : "Id",
"OBJECTID" : "Object ID",
"sourceCountry" : "Country code",
"areaType" : "Area type",
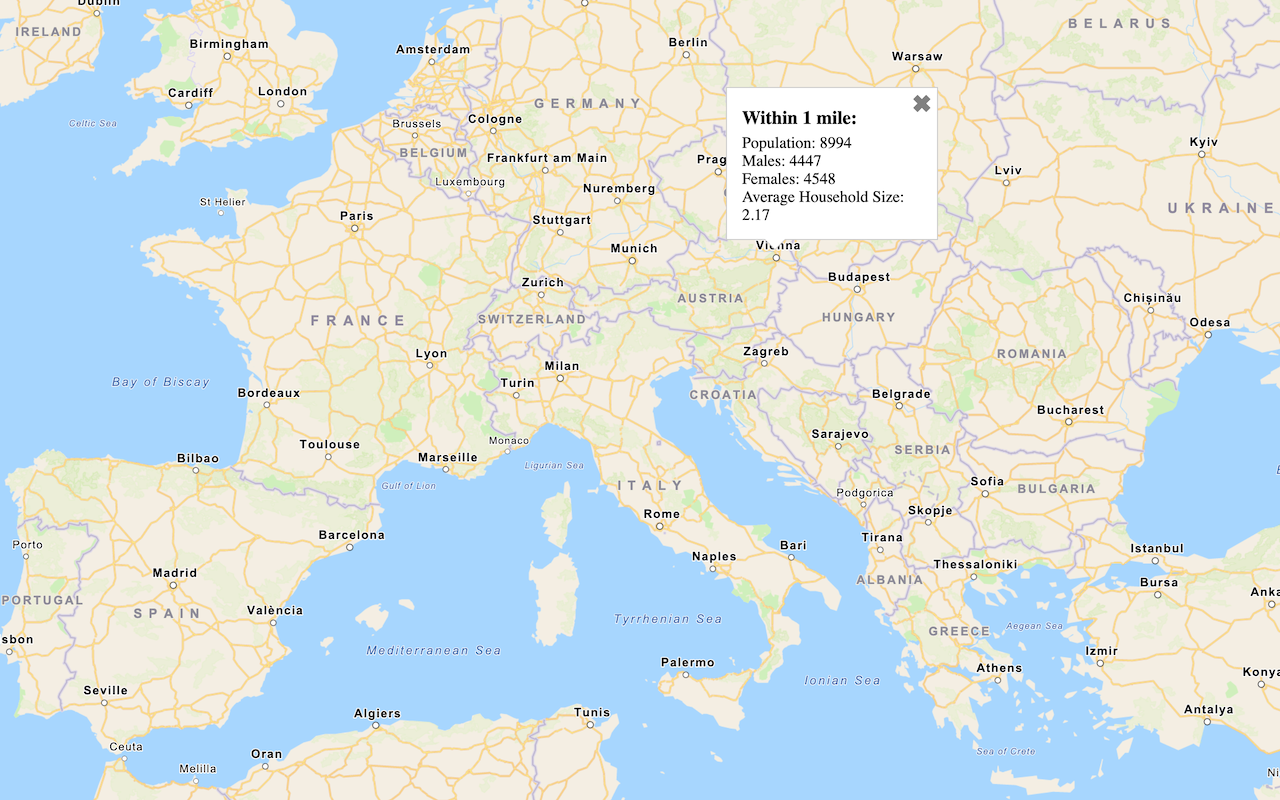
4. Use the results
After you retrieve the data from the service, the most common step is to display the data in a map.
Example
APIs
function getDemographicData(point) {
// Request demographic data
arcgisRest.queryDemographicData({
studyAreas: [{ "geometry": { "x": point.longitude, "y": point.latitude } }],
authentication: authentication
})
.then((response) => {
if (response.results[0].value.FeatureSet.length > 0 &&
response.results[0].value.FeatureSet[0].features.length > 0) {
const attributes = response.results[0].value.FeatureSet[0].features[0].attributes;
showData(attributes, point);
} else {
console.log("No data found.");
}
});
}
Tutorials
Query demographic data
Query demographic information for locations around the world with the GeoEnrichment service.

Enrich data sources
Enrich data with demographic information and local business facts using the spatial analysis service.
Find data using analysis variables
Learn how to use the Analysis Variable Finder to get enrichment data.
Find data using data collections
Learn how to use the Data Collection Finder to get enrichment data.
Services
GeoEnrichment service
Find facts and demographic information about a location or area.
API support
- 1. Access via ArcGIS REST JS or use a task.
- 2. Access via HTTP request.
- 3. Access via HTTP request and authentication.
- 4. Access via ArcGIS REST JS.