The spatial analysis service is a ready-to-use service that performs complex geometric and data analyses on feature data to discover relationships and patterns.
Key features
You can use the spatial analysis service to:
- Understand where features are or where multiple features exist.
- Measure sizes, shapes, and distributions of features.
- Analyze relationships and interactions between features.
- Detect and quantify patterns and relationships between features.
- Make predictions based on existing or theoretical patterns and relationships.
How the spatial analysis service works
The spatial analysis service allows you to perform server-side operations on large collections of features. All operations are executed as job requests, which support long transactions.
The steps to access the service are:
- Get the spatial analysis service URL from your organization.
- Submit a job request to the service with the operation and parameters.
- Check the status to see when the job is complete.
- Get the results.
Learn more about executing job requests in How to perform feature analysis.
Get the spatial analysis service URL
In order to make a request to the spatial analysis service, you need to get the URL first. The analysis service URL is unique to your organization and will look something like this:
https://analysis3.arcgis.com/arcgis/rest/services/tasks/GPServerTo find the URL specific to your organization you need to make a call to the portal service's /sharing/rest/portals/self endpoint.
Within the response, the helper object contains the list of service URLs that your organization can access. If your organization has permission to access the spatial analysis service, you will see the analysis URL.
To make a request to get the URL, see the example below:
Request
POST arcgis.com/sharing/rest/portals/self HTTP/1.1
Content-Type: application/x-www-form-urlencoded
&f=json
&token=<ACCESS_TOKEN>Response (JSON)
{
"helperServices": {
// Other parameters
"analysis": {
"url": "https://<YOUR_ANALYSIS_SERVICE>/arcgis/rest/services/tasks/GPServer"
},
"geoenrichment": {
"url": "https://geoenrich.arcgis.com/arcgis/rest/services/World/GeoenrichmentServer"
}
}
}Types of operations
Feature analysis operations for the spatial analysis service are grouped by the type of problems they solve and the type of feature data returned.
Below is an overview of the operations:
- Find data: Construct SQL and spatial queries to find and extract features.
- Combine data: Overlay and merge two feature datasets.
- Summarize data: Aggregate, join, or find features near other features.
- Analyze patterns: Perform hot spot, cluster, and interpolation operations from feature data.
- Calculate geometries: Create buffers, centroids, or tessellations from feature data.
Find data
Find data operations allow you to find feature data with a SQL or spatial query, or to export feature data, to create new feature data.
Find existing locations
The Find operation selects features that satisfy one or more SQL and/or spatial expressions and returns new feature data.
URL
http://<YOUR_ANALYSIS_SERVICE>/arcgis/rest/services/tasks/GPServer/FindExistingLocations/submitJob?<parameters>Required parameters
| Name | Description | Examples |
|---|---|---|
f | The format of the data returned. | f=json f=pjson |
token | An OAuth 2.0 access token. Learn how to get an access token in Security and authentication. | token=< |
input | The point, polyline, or polygon feature data that will be used to construct the query. | [{"url":"https: |
expressions | The SQL or spatial query. | [{"operator":"","layer":0,"where":"service = 'Eten en Drinken'"}] |
Key parameters
| Name | Description | Examples |
|---|---|---|
output | A string representing the name of the hosted feature layer to return with the results. NOTE: If you do not include this parameter, the results are returned as a feature collection (JSON). | {"service |
context | A bounding box or output spatial reference for the analysis. | "extent":{"xmin: |
For a complete list of the request parameters and input values, go to the ArcGIS REST API reference.
Derive new locations
The Derive operation selects and can modify features to satisfy one or more SQL and/or spatial expressions and returns new feature data.
URL
http://<YOUR_ANALYSIS_SERVICE>/arcgis/rest/services/tasks/GPServer/DeriveNewLocations/submitJob?<parameters>Required parameters
| Name | Description | Examples |
|---|---|---|
f | The format of the data returned. | f=json f=pjson |
token | An OAuth 2.0 access token. Learn how to get an access token in Security and authentication. | token=< |
input | The layer(s) that will be used to construct the query. | [{"url":"https: |
expressions | The SQL or spatial query. | [{"operator":"","layer":0,"selecting |
Key parameters
| Name | Description | Examples |
|---|---|---|
output | A string representing the name of the hosted feature layer to return with the results. NOTE: If you do not include this parameter, the results are returned as a feature collection (JSON). | {"service |
context | A bounding box or output spatial reference for the analysis. | "extent":{"xmin: |
For a complete list of the request parameters and input values, go to the ArcGIS REST API reference.
Extract data
The Extract operation selects and exports features that satisfy a SQL or spatial expression and creates new feature data stored as a file in a new item. The output features can be downloaded as a CSV, KML, FileGeoDatabase, or Shapefile. Multifile formats are stored in a zipfile.
URL
http://<YOUR_ANALYSIS_SERVICE>/arcgis/rest/services/tasks/GPServer/ExtractData/submitJob?<parameters>Required parameters
| Name | Description | Examples |
|---|---|---|
f | The format of the data returned. | f=json f=pjson |
token | An OAuth 2.0 access token. Learn how to get an access token in Security and authentication. | token=< |
input | The point, polyline, or polygon features that will be extracted. | [{"url":"https: |
Key parameters
| Name | Description | Examples |
|---|---|---|
data | The default file format is CSV. | KML, File, CSV, Shapefile |
clip | Define whether the data should be extracted from within the extent. | true |
extent | The area used to extract the input features. | [{"url":"https: |
output | A string representing the name of the hosted feature layer to return with the results. NOTE: If you do not include this parameter, the results are returned as a feature collection (JSON). | {"service |
For a complete list of the request parameters and input values, go to the ArcGIS REST API reference.
Combine data
Combine data operations allow you to merge, overlay, and join multiple sources of feature data to create new feature data.
Merge layers
The Merge operation combines two feature datasets and returns new feature data. The input data must contain the same type of geometry (point, polyline, or polygon).
URL
http://<YOUR_ANALYSIS_SERVICE>/arcgis/rest/services/tasks/GPServer/MergeLayers/submitJob?<parameters>Required parameters
Name | Description | Examples |
|---|---|---|
f | The format of the data returned. | f=json f=pjson |
token | An OAuth 2.0 access token. Learn how to get an access token in Security and authentication. | token=< |
input | The point, polyline, or polygon features to merge with the merge. | {"url": < {"layer |
merge | The point, polyline, or polygon features to merge with the input. The mergeLayer must contain the same feature type (point, polyline, or polygon) as the inputLayer. | {"url": < {"layer |
Key parameters
Name | Description | Examples |
|---|---|---|
merging | An array of values that describe how fields from the merge are to be modified. By default, all fields from both inputs will be carried across to the output mergedLayer. | ['Temp Remove', 'Risk |
output | A string representing the name of the hosted feature layer to return with the results. NOTE: If you do not include this parameter, the results are returned as a feature collection (JSON). | {"service |
For a complete list of the request parameters and input values, go to the ArcGIS REST API reference.
Overlay layers
The Overlay operation combines two or more feature datasets using either intersect, union, or erase methods. The operation returns a new feature dataset that contains the feature attributes of the input layers.
URL
http://<YOUR_ANALYSIS_SERVICE>/arcgis/rest/services/tasks/GPServer/OverlayLayers/submitJob?<parameters>Required parameters
Name | Description | Examples |
|---|---|---|
f | The format of the data returned | f=json f=pjson |
token | An OAuth 2.0 access token. Learn how to get an access token in Security and authentication. | token=< |
input | The point, line, or polygon features that will be overlayed with the overlay parameter. | {"url": < |
overlay | The features that will be overlaid with the inputLayer parameter features. | {"url": < |
Key parameters
Name | Description | Examples |
|---|---|---|
overlay | The type of overlay to be performed. [Intersect, Union, Erase] | "overlay |
output | The type of intersection to be found. This parameter is only valid when the overlayType parameter value is Intersect. [Input,Line,Point] | "output |
output | A string representing the name of the hosted feature layer to return with the results. NOTE: If you do not include this parameter, the results are returned as a feature collection (JSON). | {"service |
For a complete list of the request parameters and input values, go to the ArcGIS REST API reference.
Join features
The Join operation combines attributes from one feature datasets to another based on spatial and/or attribute relationships and returns new feature data.
URL
http://<YOUR_ANALYSIS_SERVICE>/arcgis/rest/services/tasks/GPServer/JoinFeatures/submitJob?<parameters>Required parameters
| Name | Description | Examples |
|---|---|---|
f | The format of the data returned | f=json f=pjson |
token | An OAuth 2.0 access token. Learn how to get an access token in Security and authentication. | token=< |
target | The point, line, polygon, or table layer that will have attributes from the join parameter appended to its table. | {"url": < |
join | The point, line, polygon, or table layer that will be joined to the target parameter. | {"url": < |
Key parameters
| Name | Description | Examples |
|---|---|---|
attribute | Defines an attribute relationship used to join features. Features are matched when the field values in the join layer are equal to field values in the target layer. | [{"target |
join | A string representing the type of join (JoinOneToOne or JoinOneToMany) that will be applied. | "join |
output | A string representing the name of the hosted feature layer to return with the results. NOTE: If you do not include this parameter, the results are returned as a feature collection (JSON). | {"service |
For a complete list of the request parameters and input values, go to the ArcGIS REST API reference.
Dissolve boundaries
The Dissolve operation combines polygons from feature datasets that ovelap or share a common boundary and returns new feature data.
URL
http://<YOUR_ANALYSIS_SERVICE>/arcgis/rest/services/tasks/GPServer/DissolveBoundaries/submitJob?<parameters>Required parameters
Name | Description | Examples |
|---|---|---|
f | The format of the data returned | f=json f=pjson |
token | An OAuth 2.0 access token. Learn how to get an access token in Security and authentication. | token=< |
input | The layer containing polygon features that will be dissolved. | {"url": < {"layer |
Key parameters
| Name | Description | Examples |
|---|---|---|
dissolve | One or more fields from the input that control which polygons are merged. | "dissolve |
summary | A list of field names and statistical summary type that you wish to calculate from the polygons that are dissolved together | "summary |
output | A string representing the name of the hosted feature layer to return with the results. NOTE: If you do not include this parameter, the results are returned as a feature collection (JSON). | {"service |
For a complete list of the request parameters and input values, go to the ArcGIS REST API reference.
Summarize data
Summarize data operations allow you to calculate spatial and attribute statistics on feature data to create new feature data.
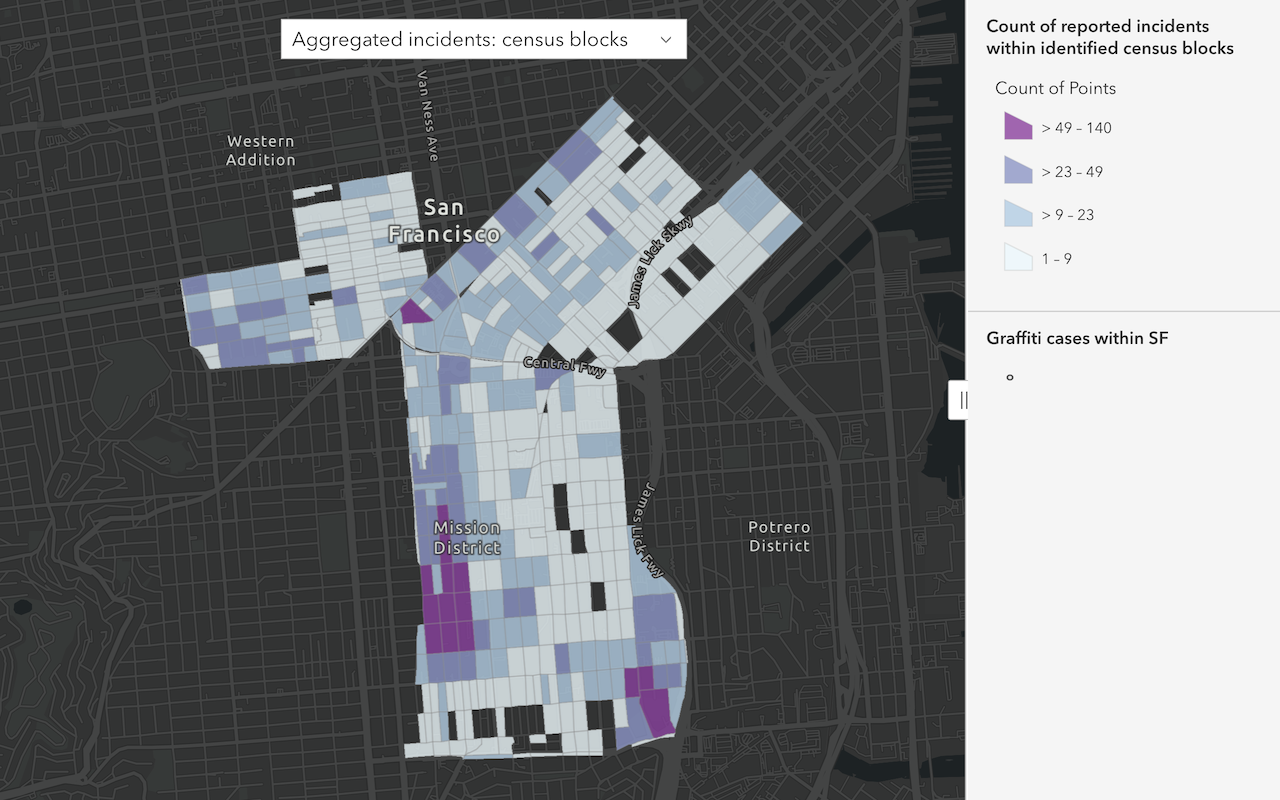
Aggregate points
The Aggregate operation determines which points fall inside polygons using a point-in-polygon spatial relationship and returns new feature data based on the analysis.
URL
http://<YOUR_ANALYSIS_SERVICE>/arcgis/rest/services/tasks/GPServer/AggregatePoints/submitJob?<parameters>Required parameters
Name | Description | Examples |
|---|---|---|
f | The format of the data returned | f=json f=pjson |
token | An OAuth 2.0 access token. Learn how to get an access token in Security and authentication. | token=< |
point | The point features aggregated into the polygons in the polygon. | {"url": < {"layer |
Key parameters
| Name | Description | Examples |
|---|---|---|
polygon | The polygon features (areas) into which the input points will be aggregated. | {"url": <feature service layer url> {"layer |
keep | A Boolean value that specifies whether the polygons that have no points within them should be returned in the output. The default is true. | true | false |
summary | A list of field names and statistical summary type that you want to calculate for all points within each polygon. Note that the count of points within each polygon is always returned. | "summary |
group | A field name in the pointLayer. Points that have the same value for the group by field will have their own counts and summary field statistics. You can create statistical groups using an attribute in the analysis layer. For example, if you are aggregating crimes to neighborhood boundaries, you may have a Crime_ attribute with five crime types. Each unique crime type forms a group, and the statistics you choose will be calculated for each unique value of Crime_. | "group |
output | A string representing the name of the hosted feature layer to return with the results. NOTE: If you do not include this parameter, the results are returned as a feature collection (JSON). | {"service |
For a complete list of the request parameters and input values, go to the ArcGIS REST API reference.
Summarize center and dispersion
The Summarize operation finds central features and directional distribution in feature data. It calculates the central, mean center, median center, and ellipse of features to determine the distribution.
URL
http://<YOUR_ANALYSIS_SERVICE>/arcgis/rest/services/tasks/GPServer/SummarizeCenterAndDispersion/submitJob?<parameters>Required parameters
| Name | Description | Examples |
|---|---|---|
analysis | The point, line, or polygon features to be analyzed. | {"url": < |
token | An OAuth 2.0 access token. Learn how to get an access token in Security and authentication. | token=< |
f | The format of the data returned | f=json f=pjson |
Key parameters
| Name | Description | Examples |
|---|---|---|
summarize | The method with which to summarize the analysis. | "summarize |
ellipse | The size of the output ellipse in standard deviations. The default ellipse size is 1. Valid choices are 1, 2, or 3 standard deviations. | "ellipseSize": "3 standard deviations" |
weight | A numeric field in the analysis to be used to weight locations according to their relative importance. | |
output | A string representing the name of the hosted feature layer to return with the results. NOTE: If you do not include this parameter, the results are returned as a feature collection (JSON). | {"service |
For a complete list of the request parameters and input values, go to the ArcGIS REST API reference.
Summarize nearby
The Summarize operation find features within a specified distance of other feature data and returns new feature data from the analysis. The distnce measure can be a straight line or defined by travel mode.
URL
http://<YOUR_ANALYSIS_SERVICE>/arcgis/rest/services/tasks/GPServer/SummarizeNearby/submitJob?<parameters>Required parameters
| Name | Description | Examples |
|---|---|---|
f | The format of the data returned | f=json f=pjson |
token | An OAuth 2.0 access token. Learn how to get an access token in Security and authentication. | token=< |
sum | Point, line, or polygon features from which distances will be measured to features in the summary. | {"url": < {"layer |
summary | Point, line, or polygon features. Features in this layer that are within the specified distance to features in the sum will be summarized. | {"url": < {"layer |
Key parameters
| Name | Description | Examples |
|---|---|---|
near | Defines what type of distance measurement you want to use: straight-line distance, or by measuring travel time or travel distance along a street network using various modes of transportation known as travel modes. The default is Straight. For details about supported travel modes see the GetTravelModes operation from the Utilities service. | "near |
distances | A list of double values that defines the search distance (for StraightLine and distance-based travel modes) or time (for time-based travel modes). You can enter a single distance value or multiple values, separating each value with a space. Features that are within (or equal to) the distances you enter will be summarized. The units of the distance values are supplied by the units parameter. | "distances": [4.0] |
units | If near is Straight or a distance-based travel mode, this is the linear unit to be used with the distance values specified in distances. If near is a time-based travel mode, then units are time based | "units": "Miles" "Units": "Minutes" |
return | If true, the resultLayer will contain areas defined by the specified near. For example, if using a Straight value of 5 miles, the resultLayer will contain areas with a 5-mile radius around the input sum features. | `true |
output | A string representing the name of the hosted feature layer to return with the results. NOTE: If you do not include this parameter, the results are returned as a feature collection (JSON). | {"service |
For a complete list of the request parameters and input values, go to the ArcGIS REST API reference.
Summarize within
The Summarize operation find areas (and portions of areas) that overlap between two feature datasets, calculates statistics about the overlap, and returns new feature data.
URL
http://<YOUR_ANALYSIS_SERVICE>/arcgis/rest/services/tasks/GPServer/SummarizeWithin/submitJob?<parameters>Required parameters
| Name | Description | Examples |
|---|---|---|
f | The format of the data returned. | f=json f=pjson |
token | An OAuth 2.0 access token. Learn how to get an access token in Security and authentication. | token=< |
sum | The polygon features. Features, or portions of features, in the summary that fall within the boundaries of these polygons will be summarized. | {"url": < {"layer |
summary | Point, line, or polygon features that will be summarized for each polygon in the sum. | {"url": < {"layer |
Key parameters
| Name | Description | Examples |
|---|---|---|
sum | A Boolean value that instructs the task to calculate statistics based on shape type of the summary, such as the count of points, the total length of lines, or the total area of polygons of the summary within each polygon in the sum. If the summary is lines or polygons, the count of features within each summary polygon is returned. | true | false |
shape | When summary contains polygons: Acres | Hectares | SquareMeters | SquareKilometers | SquareMiles | SquareYards | SquareFeet When summary contains lines: Meters | Kilometers | Feet | Yards | Miles | "shape |
output | A string representing the name of the hosted feature layer to return with the results. NOTE: If you do not include this parameter, the results are returned as a feature collection (JSON). | {"service |
For a complete list of the request parameters and input values, go to the ArcGIS REST API reference.
Analyze patterns
Analyze patterns operations allow you to perform complex geometry, attribute, and statistic calculations to identify spatial patterns and relationships in feature data.
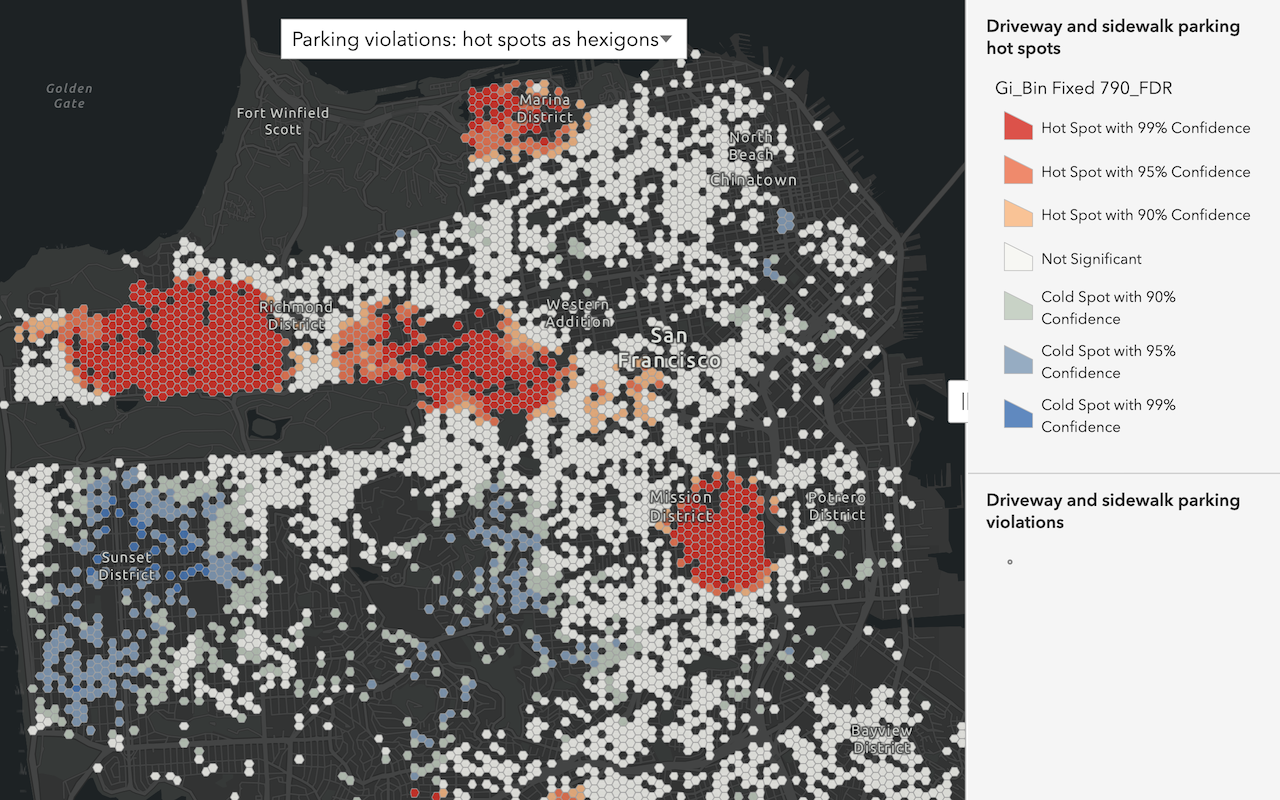
Find hot spots
The Find operation finds spatially and statistically signficant clusters of features with high and low values (point counts or field values) and returns new feature data.
URL
http://<YOUR_ANALYSIS_SERVICE>/arcgis/rest/services/tasks/GPServer/FindHotSpots/submitJob?<parameters>Required parameters
| Name | Description | Examples |
|---|---|---|
f | The format of the data returned. | f=json f=pjson |
token | An OAuth 2.0 access token. Learn how to get an access token in Security and authentication. | token=< |
analysis | The point or polygon feature layer. | {url: |
analysis | Use if the analysis layer contains polygons. | counts, rates, averages |
Key parameters
| Name | Description | Examples |
|---|---|---|
shape | Use if the analysis layer contains points. | hexagon, fishnet |
bounding | When the analysis layer contains points and no analysis is specified, you can provide a boundary for the analysis. | {url: |
output | A string representing the name of the hosted feature layer to return with the results. NOTE: If you do not include this parameter, the results are returned as a feature collection (JSON). | {"service |
context | A bounding box or output spatial reference for the analysis. | "extent":{"xmin: |
For a complete list of the request parameters and input values, go to the ArcGIS REST API reference.
Find outliers
The Find operation find spatial and statistical anomalies in clusters of feature dataand returns new feature data.
URL
http://<YOUR_ANALYSIS_SERVICE>/arcgis/rest/services/tasks/GPServer/FindOutliers/submitJob?<parameters>Required parameters
| Name | Description | Examples |
|---|---|---|
f | The format of the data returned. | f=json f=pjson |
token | An OAuth 2.0 access token. Learn how to get an access token in Security and authentication. | token=< |
analysis | The point or polygon feature layer. | {url: |
analysis | Use if the analysis layer contains polygons. | counts, rates, averages |
Key parameters
| Name | Description | Examples |
|---|---|---|
shape | Use if the analysis layer contains points. | hexagon, fishnet |
bounding | When the analysis layer contains points and no analysis is specified, you can provide a boundary for the analysis. | {url: |
output | A string representing the name of the hosted feature layer to return with the results. NOTE: If you do not include this parameter, the results are returned as a feature collection (JSON). | {"service |
context | A bounding box or output spatial reference for the analysis. | "extent":{"xmin: |
For a complete list of the request parameters and input values, go to the ArcGIS REST API reference.
Find point clusters
The Find operation finds clusters (defined by you) of point features at a specidied distance and returns new feature data.
URL
http://<YOUR_ANALYSIS_SERVICE>/arcgis/rest/services/tasks/GPServer/FindPointClusters/submitJob?<parameters>Required parameters
| Name | Description | Examples |
|---|---|---|
f | The format of the data returned. | f=json f=pjson |
token | An OAuth 2.0 access token. Learn how to get an access token in Security and authentication. | token=< |
analysis | The point data. | {url: |
min | Define the minimum number of features to be considered a cluster. | 5 |
Key parameters
| Name | Description | Examples |
|---|---|---|
search | A double value to use as the maximum distance to search for neighboring features. | 200 |
search | Must be provided if search is specified. | Miles, Feet, Meters, Kilometers |
output | A string representing the name of the hosted feature layer to return with the results. NOTE: If you do not include this parameter, the results are returned as a feature collection (JSON). | {"service |
context | A bounding box or output spatial reference for the analysis. | "extent":{"xmin: |
For a complete list of the request parameters and input values, go to the ArcGIS REST API reference.
Calculate density
The Calculate operation spreads known quantities of point or line attributes to create polygon features that represent areas of high and low density and returns new feature data.
URL
http://<YOUR_ANALYSIS_SERVICE>/arcgis/rest/services/tasks/GPServer/CalculateDensity/submitJob?<parameters>Required parameters
| Name | Description | Examples |
|---|---|---|
f | The format of the data returned. | f=json f=pjson |
token | An OAuth 2.0 access token. Learn how to get an access token in Security and authentication. | token=< |
input | The point or polyline features from the feature dataset. | {"url":"https: |
Key parameters
| Name | Description | Examples |
|---|---|---|
area | The units of the calculated density values. | Square, Square |
bounding | The polygon(s) from a hosted feature layer or feature collection in which you want densities to be calculated. | {"url":"https: |
classification | How density values will be classified. | Natural |
num | Number used to divide the range of predicted values into distinct classes. | 10 |
output | A string representing the name of the hosted feature layer to return with the results. NOTE: If you do not include this parameter, the results are returned as a feature collection (JSON). | {"service |
context | A bounding box or output spatial reference for the analysis. | "extent":{"xmin: |
For a complete list of the request parameters and input values, go to the ArcGIS REST API reference.
Interpolate points
The Interpolate operation finds and predicts new features and attribute values in point feature data and returns new feature data.
http://<YOUR_ANALYSIS_SERVICE>/arcgis/rest/services/tasks/GPServer/InterpolatePoints/submitJob?<parameters>Required parameters
| Name | Description | Examples |
|---|---|---|
f | The format of the data returned. | f=json f=pjson |
token | An OAuth 2.0 access token. Learn how to get an access token in Security and authentication. | token=< |
input | The point feature collection or hosted feature layer. | {url: |
field | The numeric field containing the values to interpolate. | Elevation |
Key parameters
| Name | Description | Examples |
|---|---|---|
interpolate | A value declaring the preference for speed versus accuracy. The default is 5. | 1, 5, 9 |
classification | Determines how the predicted values will be classified into areas. The default is Geometric. | Equal, Equal, Geometric, Manual |
class | If the classification is Manual, then provide the class break values as a list. | [1,3,5] |
bounding | The layer specifying the polygons in which you want values to be interpolated. | {url: |
output | A string representing the name of the hosted feature layer to return with the results. NOTE: If you do not include this parameter, the results are returned as a feature collection (JSON). | {"service |
context | A bounding box or output spatial reference for the analysis. | "extent":{"xmin: |
For a complete list of the request parameters and input values, go to the ArcGIS REST API reference.
Calculate geometries
Calculate geometries operations allow you to perform different types of geometric calculations on feature data and to create new feature data such as grids, tessellations, and bins.
Create buffers
The Create operation creates areas at a specified distances around a point, line, or polygon feature and returns new feature data.
URL
http://<YOUR_ANALYSIS_SERVICE>/arcgis/rest/services/tasks/GPServer/CreateBuffers/submitJob?<parameters>Required parameters
| Name | Description | Examples |
|---|---|---|
f | The format of the data returned. | f=json f=pjson |
token | An OAuth 2.0 access token. Learn how to get an access token in Security and authentication. | token=< |
input | The point, line, or polygon features to be buffered. | {"url":"https: |
distances | If not using field. The value with which the buffer will be calculated. | 1 |
field | If not using distances. A field within the input containing a buffer distance. | ATTRIBUTE_ |
Key parameters
| Name | Description | Examples |
|---|---|---|
units | The unit to be used with the specified distance values. | Meters, Kilometers, Miles |
dissolve | Determines whether overlapping buffers are split, dissolved, or kept. | None, Dissolve, Split |
output | A string representing the name of the hosted feature layer to return with the results. NOTE: If you do not include this parameter, the results are returned as a feature collection (JSON). | {"service |
context | A bounding box or output spatial reference for the analysis. | "extent":{"xmin: |
For a complete list of the request parameters and input values, go to the ArcGIS REST API reference.
Find centroids
The Find operation allows you to find the representative center of each multipoint, polyline, or polygon feature and returns new feature data.
URL
http://<YOUR_ANALYSIS_SERVICE>/arcgis/rest/services/tasks/GPServer/FindCentroids/submitJob?<parameters>Required parameters
| Name | Description | Examples |
|---|---|---|
f | The format of the data returned. | f=json f=pjson |
token | An OAuth 2.0 access token. Learn how to get an access token in Security and authentication. | token=< |
input | The multipoint, line, or polygon features that will be used to generate centroid point features. | {"url":"https: |
Key parameters
| Name | Description | Examples |
|---|---|---|
point | Output points are determined by the calculated geometric center of each input feature. If set to true the points will be contained by the bounds of the input feature. | false (default) |
output | A string representing the name of the hosted feature layer to return with the results. NOTE: If you do not include this parameter, the results are returned as a feature collection (JSON). | {"service |
context | A bounding box or output spatial reference for the analysis. | "extent":{"xmin: |
For a complete list of the request parameters and input values, go to the ArcGIS REST API reference.
Generate tessellations
The Generate operation allows you to create equally sized square, hexagon, triangle, or diamond geometry bins for an area or extent and returns new feature data.
URL
http://<YOUR_ANALYSIS_SERVICE>/arcgis/rest/services/tasks/GPServer/GenerateTessellations/submitJob?<parameters>Required parameters
| Name | Description | Examples |
|---|---|---|
f | The format of the data returned. | f=json f=pjson |
token | An OAuth 2.0 access token. Learn how to get an access token in Security and authentication. | token=< |
bin | The tessellation shape. | HEXAGON, SQUARE, DIAMOND, TRIANGLE, TRANSVERSEHEXAGON |
bin | The size of each bin. | 500 |
Key parameters
| Name | Description | Examples |
|---|---|---|
bin | The unit to be used with the specified value in bin. | Feet,Miles,Kilometers |
extent | The extent that the tessellations will cover. | {"url":"https: |
output | A string representing the name of the hosted feature layer to return with the results. NOTE: If you do not include this parameter, the results are returned as a feature collection (JSON). | {"service |
context | A bounding box or output spatial reference for the analysis. | "extent":{"xmin: |
For a complete list of the request parameters and input values, go to the ArcGIS REST API reference.
Authentication
To make authenticated requests, you need to use user authentication (formerly ArcGIS identity). It grants a short-lived token, generated via OAuth 2.0, giving your application permission to access the content and services authorized to an existing ArcGIS user's account.
Learn more about getting access tokens in Security and authentication.
API support
You cannot use ArcGIS Maps SDKs for Native Apps to access the spatial analysis service. Use ArcGIS API for Python, ArcGIS REST JS, or ArcGIS Maps SDK for JavaScript.
| Find existing locations | Derive new locations | Extract features | |
|---|---|---|---|
| ArcGIS Maps SDK for JavaScript | 1 | 1 | 1 |
| ArcGIS Maps SDK for .NET | |||
| ArcGIS Maps SDK for Kotlin | |||
| ArcGIS Maps SDK for Swift | |||
| ArcGIS Maps SDK for Java | |||
| ArcGIS Maps SDK for Qt | |||
| ArcGIS API for Python | |||
| ArcGIS REST JS | 1 | 1 | 1 |
| Esri Leaflet | 2 | 2 | 2 |
| MapBox GL JS | 2 | 2 | 2 |
| OpenLayers | 2 | 2 | 2 |
- 1. Access with geoprocessing task
- 2. Access via ArcGIS REST JS
- 1. Access with geoprocessing task
- 2. Access via ArcGIS REST JS
| Aggregate points | Summarize center and dispersion | Summarize nearby | Summarize within | |
|---|---|---|---|---|
| ArcGIS Maps SDK for JavaScript | 1 | 1 | 1 | 1 |
| ArcGIS Maps SDK for .NET | ||||
| ArcGIS Maps SDK for Kotlin | ||||
| ArcGIS Maps SDK for Swift | ||||
| ArcGIS Maps SDK for Java | ||||
| ArcGIS Maps SDK for Qt | ||||
| ArcGIS API for Python | ||||
| ArcGIS REST JS | 1 | 1 | 1 | 1 |
| Esri Leaflet | 2 | 2 | 2 | 2 |
| MapBox GL JS | 2 | 2 | 2 | 2 |
| OpenLayers | 2 | 2 | 2 | 2 |
- 1. Access with geoprocessing task
- 2. Access via ArcGIS REST JS
| Find hot spots | Find outliers | Find point clusters | Calculate density | Interpolate points | |
|---|---|---|---|---|---|
| ArcGIS Maps SDK for JavaScript | 1 | 1 | 1 | 1 | 1 |
| ArcGIS Maps SDK for .NET | |||||
| ArcGIS Maps SDK for Kotlin | |||||
| ArcGIS Maps SDK for Swift | |||||
| ArcGIS Maps SDK for Java | |||||
| ArcGIS Maps SDK for Qt | |||||
| ArcGIS API for Python | |||||
| ArcGIS REST JS | 1 | 1 | 1 | 1 | 1 |
| Esri Leaflet | 2 | 2 | 2 | 2 | 2 |
| MapBox GL JS | 2 | 2 | 2 | 2 | 2 |
| OpenLayers | 2 | 2 | 2 | 2 | 2 |
- 1. Access with geoprocessing task
- 2. Access via ArcGIS REST JS
- 1. Access with geoprocessing task
- 2. Access via ArcGIS REST JS
Pricing
You can only access the spatial analysis service with an ArcGIS Online account. Each operation performed consumes credits. To learn more, go to Understand credits in the ArcGIS Online documentation.
Tutorials
Learn how to perform related analyses interactively with Map Viewer and programmatically with ArcGIS API for Python, ArcGIS REST JS, and ArcGIS REST API.
Find data sources
Discover data in ArcGIS that you can use for feature analysis.
Create data sources
Import, create, and generate data for feature analysis.

Enrich data sources
Enrich data with demographic information and local business facts using the spatial analysis service.
Find and extract data
Find data with attribute and spatial queries using find analysis operations.
Combine data
Overlay, join, and dissolve features using combine analysis operations.
Summarize data
Aggregate and summarize features using summarize analysis operations.
Discover patterns in data
Find patterns and trends in data using spatial analysis operations.