Apply a renderer to a sublayer.
Use case
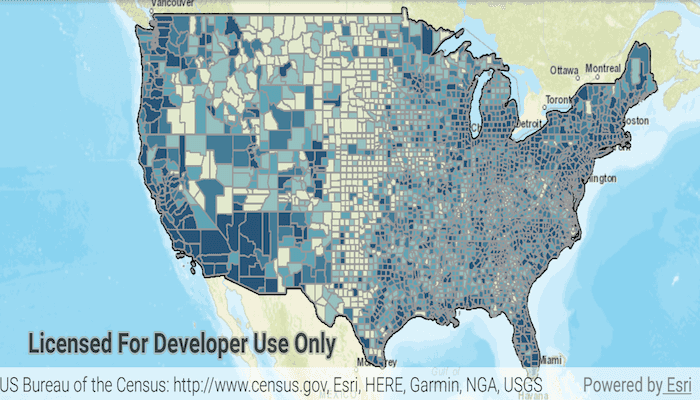
A layer showing animal populations contains sublayers for different species. A renderer could be applied which gives each sublayer a different color, so that populations of each species can be compared visually.
How to use the sample
Wait for the map image layer to load. Tap the 'Apply class break renderer' button to apply a unique value renderer to see different population ranges in the counties sub-layer data.
How it works
- Create an
ArcGISMapImageLayerfrom its URL. - After it is done loading, get its
SublayerListwithimageLayer.getSublayers(). - Cast the sublayer you want to change to the appropriate type:
(ArcGISMapImageSublayer) sublayers.get(2). - Create a
ClassBreaksRendererwith a collection ofClassBreaks for different population ranges. - Set the renderer of the sublayer with
sublayer.setRenderer(renderer).
Relevant API
- ArcGISMapImageLayer
- ArcGISMapImageSubLayer
- ClassBreaksRenderer
- ClassBreaksRenderer.ClassBreak
About the data
This application displays census data from an ArcGIS Server map service. It contains various population statistics, including total population for each county in 2007.
Additional information
The service hosting the layer must support dynamic layers to be able to change the rendering of sublayers.
Tags
class breaks, dynamic layer, dynamic rendering, renderer, sublayer, symbology, visualization
Sample Code
/*
* Copyright 2018 Esri.
*
* Licensed under the Apache License, Version 2.0 (the "License"); you may not
* use this file except in compliance with the License. You may obtain a copy of
* the License at
*
* http://www.apache.org/licenses/LICENSE-2.0
*
* Unless required by applicable law or agreed to in writing, software
* distributed under the License is distributed on an "AS IS" BASIS, WITHOUT
* WARRANTIES OR CONDITIONS OF ANY KIND, either express or implied. See the
* License for the specific language governing permissions and limitations under
* the License.
*/
package com.esri.arcgisruntime.sample.changesublayerrenderer;
import java.util.Arrays;
import android.graphics.Color;
import android.os.Bundle;
import android.util.Log;
import android.widget.Button;
import androidx.appcompat.app.AppCompatActivity;
import com.esri.arcgisruntime.ArcGISRuntimeEnvironment;
import com.esri.arcgisruntime.layers.ArcGISMapImageLayer;
import com.esri.arcgisruntime.layers.ArcGISMapImageSublayer;
import com.esri.arcgisruntime.layers.SublayerList;
import com.esri.arcgisruntime.loadable.LoadStatus;
import com.esri.arcgisruntime.mapping.ArcGISMap;
import com.esri.arcgisruntime.mapping.BasemapStyle;
import com.esri.arcgisruntime.mapping.Viewpoint;
import com.esri.arcgisruntime.mapping.view.MapView;
import com.esri.arcgisruntime.symbology.ClassBreaksRenderer;
import com.esri.arcgisruntime.symbology.ClassBreaksRenderer.ClassBreak;
import com.esri.arcgisruntime.symbology.SimpleFillSymbol;
import com.esri.arcgisruntime.symbology.SimpleLineSymbol;
public class MainActivity extends AppCompatActivity {
private static final String TAG = MainActivity.class.getSimpleName();
private MapView mMapView;
private ArcGISMapImageSublayer countiesSublayer;
@Override
protected void onCreate(Bundle savedInstanceState) {
super.onCreate(savedInstanceState);
setContentView(R.layout.activity_main);
// authentication with an API key or named user is required to access basemaps and other
// location services
ArcGISRuntimeEnvironment.setApiKey(BuildConfig.API_KEY);
// inflate mapView from layout
mMapView = findViewById(R.id.mapView);
// create a map with a Basemap Style STREETS
ArcGISMap map = new ArcGISMap(BasemapStyle.ARCGIS_STREETS);
// set the map to be displayed in this view
mMapView.setMap(map);
mMapView.setViewpoint(new Viewpoint(48.354406, -99.998267, 7500.0));
// create button to apply the render
Button renderButton = findViewById(R.id.applyRenderer);
// create map image layer from a service URL
final ArcGISMapImageLayer imageLayer = new ArcGISMapImageLayer(getString(R.string.census_map_server));
// load the layer and find one of its sublayers
imageLayer.addDoneLoadingListener(() -> {
if(imageLayer.getLoadStatus() == LoadStatus.LOADED){
// zoom to the image layers extent
mMapView.setViewpointGeometryAsync(imageLayer.getFullExtent());
// get the sublayers from the map image layer
SublayerList sublayers = imageLayer.getSublayers();
countiesSublayer = (ArcGISMapImageSublayer) sublayers.get(2);
} else {
Log.e(TAG,imageLayer.getLoadError().getMessage());
}
});
// add the layer to the map
map.getOperationalLayers().add(imageLayer);
// create a class breaks renderer to switch to
final ClassBreaksRenderer classBreaksRenderer = createPopulationClassBreaksRenderer();
// set the renderer on the counties sublayer when the button is pressed
renderButton.setOnClickListener(v -> countiesSublayer.setRenderer(classBreaksRenderer));
}
/**
* Creates a class breaks renderer for 5 ranges of populations.
*
* @return class breaks renderer
*/
private static ClassBreaksRenderer createPopulationClassBreaksRenderer() {
// create colors
final int gray = Color.rgb(153, 153, 153);
final int blue1 = Color.rgb(226, 234, 206);
final int blue2 = Color.rgb(150, 193, 191);
final int blue3 = Color.rgb(96 , 165, 181);
final int blue4 = Color.rgb(68 , 124, 150);
final int blue5 = Color.rgb(40 , 84 , 119);
// create 5 fill symbols with different shades of blue and a gray outline
SimpleLineSymbol outline = new SimpleLineSymbol(SimpleLineSymbol.Style.SOLID, gray, 1);
SimpleFillSymbol classSymbol1 = new SimpleFillSymbol(SimpleFillSymbol.Style.SOLID, blue1, outline);
SimpleFillSymbol classSymbol2 = new SimpleFillSymbol(SimpleFillSymbol.Style.SOLID, blue2, outline);
SimpleFillSymbol classSymbol3 = new SimpleFillSymbol(SimpleFillSymbol.Style.SOLID, blue3, outline);
SimpleFillSymbol classSymbol4 = new SimpleFillSymbol(SimpleFillSymbol.Style.SOLID, blue4, outline);
SimpleFillSymbol classSymbol5 = new SimpleFillSymbol(SimpleFillSymbol.Style.SOLID, blue5, outline);
// create 5 classes for different population ranges
ClassBreak classBreak1 = new ClassBreak("-99 to 8560", "-99 to 8560", -99,
8560, classSymbol1);
ClassBreak classBreak2 = new ClassBreak("> 8,560 to 18,109", "> 8,560 to 18,109", 8560,
18109, classSymbol2);
ClassBreak classBreak3 = new ClassBreak("> 18,109 to 35,501", "> 18,109 to 35,501", 18109,
35501, classSymbol3);
ClassBreak classBreak4 = new ClassBreak("> 35,501 to 86,100", "> 35,501 to 86,100", 35501,
86100, classSymbol4);
ClassBreak classBreak5 = new ClassBreak("> 86,100 to 10,110,975", "> 86,100 to 10,110,975", 86100,
10110975, classSymbol5);
// create the renderer for the POP2007 field
return new ClassBreaksRenderer("POP2007", Arrays.asList(classBreak1, classBreak2, classBreak3, classBreak4,
classBreak5));
}
}