Learn how to use Arcade
Arcade
In this tutorial, you will learn to enhance a table element
- Magnitude more than 7.5 will be rendered with the color black.
- Magnitude in the range between more than 6.0 and 7.5 will be rendered with the color red.
- Magnitude in the range between more than 4.5 and 6.0 will be rendered with the color yellow.
- Magnitude in the range between more than 3.0 and 4.5 will be rendered with the color aqua blue.
- Magnitude less than 3.0 will be rendered with the color gray.
Prerequisites
Steps
This tutorial builds upon the Create a dashboard tutorial. Please review that tutorial to learn how to:
- Create a dashboard.
- Load a web map
A web map is a map stored as a JSON object that defines properties such as the basemap layer, data layers, layer styles, and pop-up styles. Its JSON structure is defined by the web map specification. . - Display the web map data in the map and table elements.
If you have completed the Create a dashboard tutorial and have a dashboard you can work with, you can skip to the Enable advanced formatting section.
Copy dashboard tutorial to your organization
For this tutorial, you will use ArcGIS Assistant to copy the Recent Earthquakes Dashboard Tutorial to your organization.
-
Log into ArcGIS Assistant using your ArcGIS Online account.
-
Click on ArcGIS Online tab.
-
In the Filter items... search box, type the following:
Recent Earthquakes Dashboard Tutorial. -
Click on Recent Earthquakes Dashboard Tutorial by esri_devlabs and click Copy Item.
-
Select your account and click Select Account.
-
If you have a specific user account to use, select your user account and click Select User.
-
Select your root folder or click Create new folder to create a new destination folder.
-
Click Select Folder. The Item Title will automatically be populated by the dashboard title.
-
Click Copy Item to copy the dashboard to your organization.
Enable advanced formatting
Before you can add any Arcade expressions to the table element, you will need to enable Advanced formatting in the table element.
-
In the Content tab of your organization, click the Recent Earthquakes Dashboard Tutorial to view the dashboard item details.
-
In the Item details window, click Open in ArcGIS Online.
-
Click Edit Dashboard to configure the dashboard.
-
Hover over the table element and expand on the icon.
-
Click Configure.
-
In the left-panel, click on Values and enable Advanced formatting if it has not been enabled yet.
Add Arcade expression
Now that property is enabled, you can start adding Arcade expressions to renderer rows in the table.
-
Click the Expressions tab.
-
In the textbox, copy and paste the code block below:
Use dark colors for code blocks Copy var color = ""; if ($datapoint["mag"] > 7.5) { color = "#212121"; } else if (($datapoint["mag"] > 6) && ($datapoint["mag"] <= 7.5)) { color = "#FF0316"; } else if (($datapoint["mag"] > 4.5) && ($datapoint["mag"] <= 6)) { color = "#F2E643"; } else if (($datapoint["mag"] > 3) && ($datapoint["mag"] <= 4.5)) { color = "#6CEAE6"; } else { color = "#A8A8A8"; } return { cells: { mag: { displayText : $datapoint["mag"], textColor: color, backgroundColor: '', -
Click Done to save your changes.
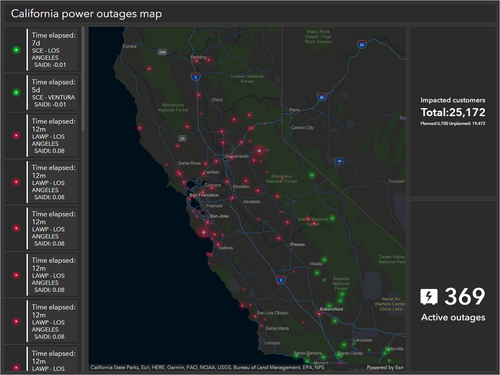
Your dashboard should look something like this.
Tutorials
Listed below are additional tutorials on formatting using Arcade with other dashboard elements.