Learn how to use ArcGIS Dashboards
Here's an overview of how you can use ArcGIS Dashboards to create your own dashboard:
-
Load a web map
A web map is a map stored as a JSON object that defines properties such as the basemap layer, data layers, layer styles, and pop-up styles. Its JSON structure is defined by the web map specification. using the Dashboards map elementA dashboard element is a visual component in ArcGIS Dashboards that displays data organized and curated from various sources like a hosted layer or web map in ArcGIS. . -
Display records of a feature layer using the Dashboards table element.
-
Set actions in the table element to sync with the map.
Prerequisites
Steps
This tutorial uses the publicly available Recent Earthquakes Tutorial web map
Create a dashboard
Now that you have a web map
-
In the Content tab of your organization, click Create app > Dashboards.
-
In the Create new dashboard window, provide a descriptive title for your dashboard and your desired tags.
-
Then, click Create dashboard.
Load the web map
You can now load the web map
-
In the left-panel, click Add element > Map to add a map element to your dashboard.
-
Click on Shared maps tab.
-
In the Search bar, type the following:
Recent Earthquakes Tutorialpublished by esri_devlabs and select it. -
Without changing the default settings, click Done in the Recent Earthquakes Tutorial configuration window.
-
In the left-panel, click Save > Save to save your work.
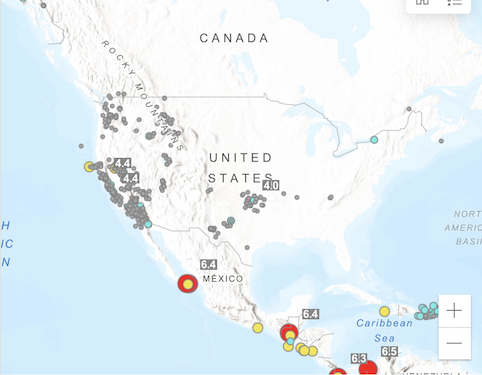
You now have a map loaded displaying earthquakes around the world.
Display layer records in a table
Now that you have a map, you can display earthquakes records using a table element in your dashboard.
-
In the left-panel, click Add element. You will then be presented with four plus signs () on each edge of the map to indicate where you can add elements within the map.
-
Click on the right of the screen > Table to add the table.
-
In the Select a layer window, expand the Recent Earthquakes layer and click Events by Magnitude.
-
In the Data > Data options window, select Features in the Table type.
-
Click Add field and add Location and Magnitude.
-
Click Done at the Table configuration window.
-
In the left-panel, click Save > Save to save your work.
You now have a map with location and magnitude of earthquake data displayed in it and a table in your dashboard.
Wiring up dashboard elements
In this step, you will configure your dashboard to allow for user interactivity by wiring up the table to the map. You will be able to click on a record and the map will pan to the location of that selected record.
-
Hover over the table element and expand on the icon.
-
Click Configure.
-
In the left-panel window, click Actions > Pan and enable panning for the Recent Earthquakes Tutorial layer.
-
Click Done at the Table configuration window.
-
In the left-panel, click Save > Save.
You can now click on a record in the table, and the map will pan to that location of the selected record. Your dashboard should look something like this.
Share the dashboard
-
In the left-panel window, click the menu icon.
-
Click Dashboard item details to view the item page of your dashboard.
-
Click the Share button on the dashboard item page.
-
Select the appropriate share level.
-
Click Save.