
Santa Monica Trails demo dashboard created with ArcGIS Dashboards
What is dashboard configuration?
Once a dashboard is created, you can configure it to meet your design requirements.
There are several ways you can accomplish this:
-
Add and arrange elements: Add various elements to a dashboard, such as maps, serial charts, gauges, tables, text, and more. Arrange and resize these elements on the canvas to create the desired view.
-
Configure data sources: Connect a dashboard to data sources, such as ArcGIS Online layers, ArcGIS Enterprise services, or other external datasets.
-
Set up filters and interactions: Define filters to enable users to interact with the dashboard and dynamically update the displayed data. You can link filters between different elements to create coordinated views.
-
Create expressions and calculations: Use data and format expressions to display specific information on a dashboard. You use ArcGIS Arcade to manipulate and analyze data within a dashboard.
-
Apply themes and branding: Customize the visual style of your dashboard by selecting a theme, defining color schemes, and adding logos or custom images to reflect your organization's branding.
Why configure a dashboard
Configuring a dashboard enables your to visualize, analyze, and communicate data effectively. A dashboard configured properly will help to facilitate decision-making, enhance situational awareness, and promote collaboration and engagement with stakeholders and customers.
How to configure a dashboard
Configuring a dashboard is easy, but the complexity may increase depending on the complexity of the data, the level of configuration needed, and the specific requirements of your project.
The general steps to configure a dashboard includes the following:
- Design the layout view
- Add and configure dashboard elements
- Connect to data sources
- Set up interactivity with dashboard elements
Design the layout view

Customize the layout of your dashboard for desktop or mobile view.
The layout view of a dashboard can be configured with elements such as maps, serial charts, tables, and text boxes onto the layout view. These elements allow you to adjust the size, position, and style of each component to create a unique look and feel. The Santa Monica Trails example dashboard above is created with these elements:
- Map: Placed at the center, and configured to display the Santa Monica Trails web map.
- Header: Enabled with the Santa Monica Trails title.
- Indicator: Configured to show number of trails, trailheads, trails for bikes, and parks and open spaces. These indicators were stacked vertically and docked to the right.
Configure dashboard elements

Example options to customize your dashboard.
Once you are done with a adding the needed elements onto the view, you will need to configure each element. In the Santa Monica Trails dashboard example,
- The map element was configured to connect to the Santa Monica Trails web map to display a map.
- The indicators were configured to connect to feature services from the Santa Monica Trails web map.
Configure element actions
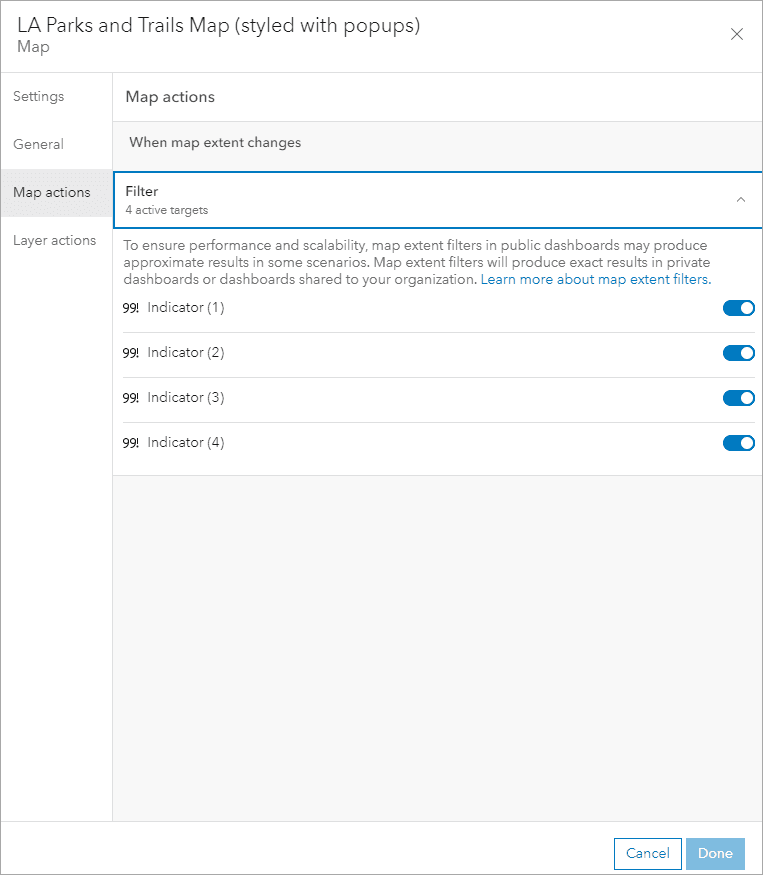
Example options to configure actions for each dashboard element.
Element actions in ArcGIS Dashboards refer to the interactive behaviors that can be configured with in elements within a dashboard. These actions allow you to interact with the dashboard elements and trigger specific responses or updates. Some common types of element actions in ArcGIS Dashboards:
-
Filter: Apply filters to other elements based on user interactions. For example, when a user clicks on a specific feature on a map, it triggers a filter action that updates a serial chart element to display only data related to that feature.
-
Zoom: Applied to a map element, this action allows users to zoom in to a specific extent or area of interest. This action is triggered by clicking record in a list element.
-
Extent change: Apply filters to other elements based on zoom levels within a map element. For example, when a user zooms to an extent, data is filtered in a list element only displaying those records that pertain to the area in the map.
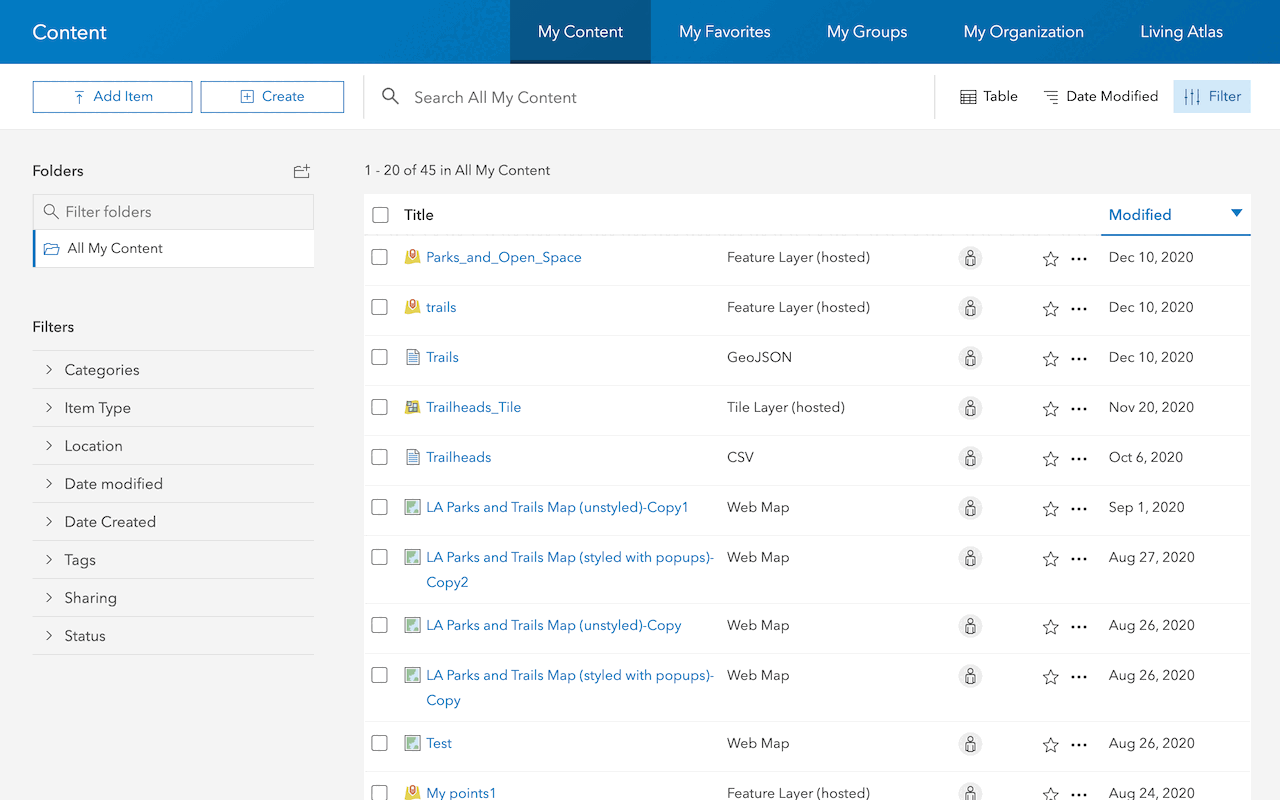
Connect data sources
Your dashboard relies on data sources, generally a web map, to populate dashboard elements with data. Connecting and modifying data sources involves updating or changing datasets or services that provide the underlying data for the elements in your dashboard. You can configure data sources by:
- Adding, removing, or modifying layers within a web map.
- Configuring a dashboard element to connect to different data sources.
- Adding a new or changing an existing data expression used to retrieve data.
Data expression
Data expressions in ArcGIS Dashboards provide a flexible way to customize and manipulate your data, allowing you to create dynamic and informative data based on your specific requirements. Using Arcade, this expression enhances the capabilities of your dashboard by enabling data-driven calculations and transformations.
Tutorials
Use tools to create different types of content and build low-code/no-code applications.
Import data as a feature layer
Use data management tools to import and create hosted feature layers.
ArcGIS Online Location Platform dashboard

Create a web map
Use Map Viewer to create a web map for your application.
Map Viewer

Style layers in a web map
Use Map Viewer to style layers in a web map.
ArcGIS Online Map Viewer
Learn more on creating and enhancing dashboards.
Create a dashboard
Create your first dashboard using ArcGIS Dashboards.
ArcGIS Online
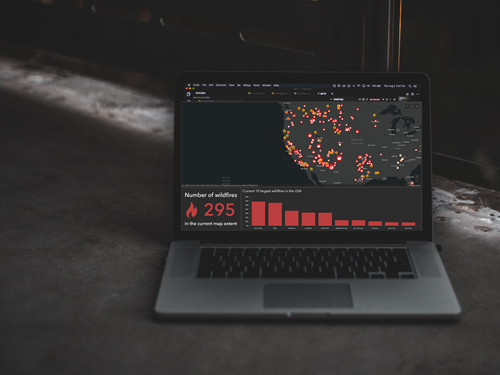
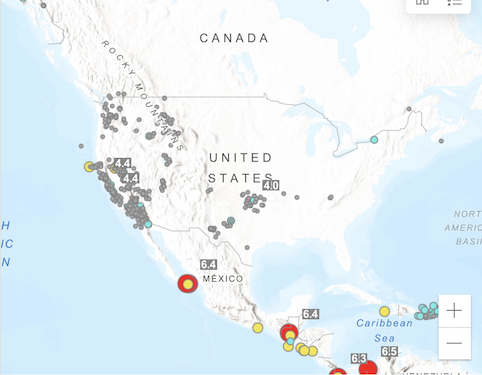
Make a dashboard to monitor wildfires
Create a dashboard showing a map of active wildfires and key indicators.
ArcGIS Online

Format data in your dashboard
Use Arcade in ArcGIS Dashboards to apply simple formatting to enhance data visualization.
ArcGIS Online
Advanced formatting in ArcGIS Dashboards
Use Arcade and HTML to derive new information and display alerts in a dashboard.
ArcGIS Online
Tools
Use tools to access the ArcGIS organization and create and manage content for your no-code applications.