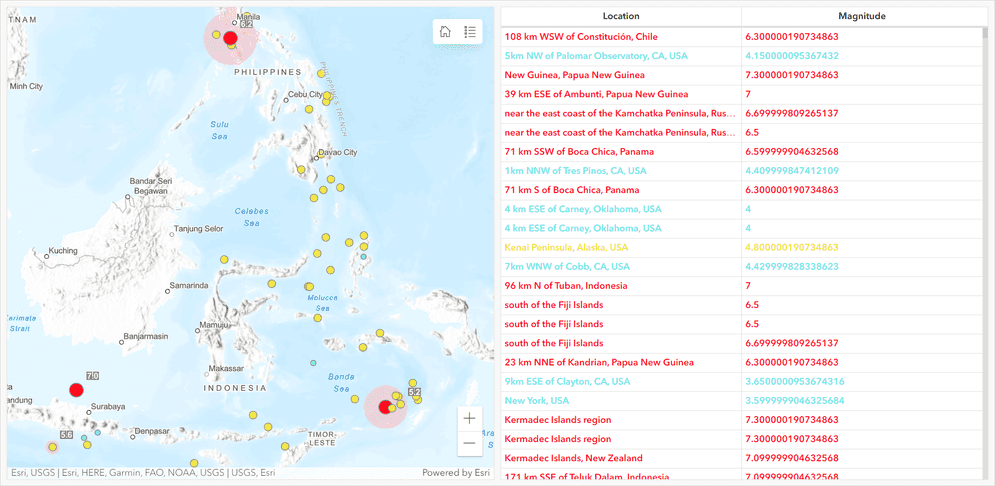
Recent earthquakes demo dashboard created with ArcGIS Dashboards
ArcGIS Dashboards allows you to implement different types of customizations to create interactive and dynamic dashboards. To do so, you need to implement Arcade expressions.
Some examples of the types of customizations you can perform with Arcade include:
- Creating dynamic texts based on conditions on a data source.
- Employing conditional formatting on labels.
- Performing runtime filtering and querying of data.
What is Arcade?
Arcade is a scripting language and specifically designed for use in ArcGIS including ArcGIS Dashboards. It is used to create expressions and data-driven visualizations in dashboards. Some of the actions you can perform using Arcade:
Why use Arcade?
Arcade provides a consistent language syntax that can be used across different elements of a dashboard, such as gauges, indicators, and tables. This ensures expressions written for one component can be easily reused and interpreted correctly in other parts of the dashboard. It promotes consistency and saves time when creating and maintaining dashboards.
How it works
Arcade expressions are snippets of code that can be embedded within various dashboard elements of your dashboard, such as text, filters, charts, and label elements.
The following are examples of operations you can perform to extend a dashboard with Arcade.
Data transformation
Using Arcade, data expressions in ArcGIS Dashboards allow you to transform data in a dashboard. From statistical calculations to conditional formatting, you use data expressions to create data-driven dashboards that dynamically respond to changes in the underlying data, enhancing the interactivity and relevance of the visualizations.
var population = $feature.Population;
var area = $feature.Area;
return Round(population / area, 2);In the above example, the Arcade expression calculates the population density of a geographic feature based on its population and area values.
-
The
Round()function is used to round the calculated density to two decimal places. -
The expression returns the calculated population density, which can be used to display dynamic information in an indicator element in a dashboard.
Data formatting
Formatting expressions in ArcGIS Dashboards allow you to customize the appearance of data in a dashboard. These expressions enable formatting of numbers, dates, and text based on specific criteria. By using formatting expressions, you can apply conditional styling, such as color-coding or data bars, to highlight important information.
var text = $feature.Text;
var category = $feature.Category;
if (category == "Important") {
return "<b>" + text + "</b>";
} else if (category == "Highlighted") {
return "<i>" + text + "</i>";
} else {
return text;
}In the above example, the text attribute represents the text to be displayed, while the category attribute determines the formatting style of the text. The format expression checks the value of the category attribute:
- If the category is Important, it wraps the text within
<tags to apply bold formatting.b> - If the category is Highlighted, it wraps the text within
<tags to apply italic formatting.i> - If the conditions are not met, text without any text formatting is returned.
Data creation
Arcade allows you to combine multiple data sources to create a new data source that can populate a table element or a chart element.
var layer1 = FeatureSetByName($map, 'Layer1');
var layer2 = FeatureSetByName($map, 'Layer2');
var combinedFeatures = FeatureSet([]);
for (var i = 0; i < Count(layer1); i++) {
var feature1 = Element(layer1, i);
var feature2 = Filter(layer2, 'ID = ' + feature1.attributes.ID);
if (Count(feature2) > 0) {
var mergedAttributes = Concatenate(feature1.attributes, First(feature2).attributes);
var mergedGeometry = Geometry(feature1);
var mergedFeature = {
'attributes': mergedAttributes,
'geometry': mergedGeometry
};
Add(combinedFeatures, mergedFeature);
}
}
return combinedFeatures;The above example:
-
Featurefunction is used to retrieve the feature sets of Layer1 and Layer2.S e t By Name -
The code then initializes an empty
combinedFeatures FeatureusingSet Feature.Set([]) -
A loop is used to iterate over the features in Layer1. For each feature, we filter Layer2 using the
IDattribute of Layer1 to find a matching feature in Layer2. -
If a matching feature is found, the attributes of the two features are concatenated using
Concatenate, and the geometry of the feature from Layer1 is retained. -
A new feature object is created with the merged attributes and geometry, and it is added to the
combinedFeatures Featureusing theSet Addfunction. -
combinedFeatures Feature, containing the merged features from both layers, is returned.Set
Tutorials
Create a dashboard
Create your first dashboard using ArcGIS Dashboards.
ArcGIS Online

Format data in your dashboard
Use Arcade in ArcGIS Dashboards to apply simple formatting to enhance data visualization.
ArcGIS Online
Advanced formatting in ArcGIS Dashboards
Use Arcade and HTML to derive new information and display alerts in a dashboard.
ArcGIS Online