The general steps to use ArcGIS Dashboards are:
1. Create a web map
To create a web app using ArcGIS Dashboards, you will need to start by creating a web map. To do this, click Map in your organization. You will be taken to the Map Viewer, where you can add layers, define symbology, and set up pop-ups and other properties.
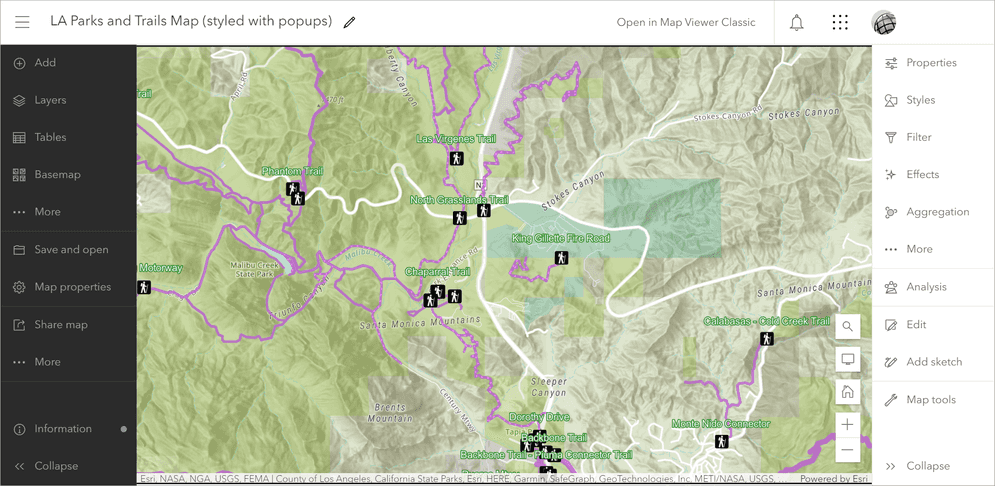
Use the Map Viewer to create a web map.
2. Create a dashboard
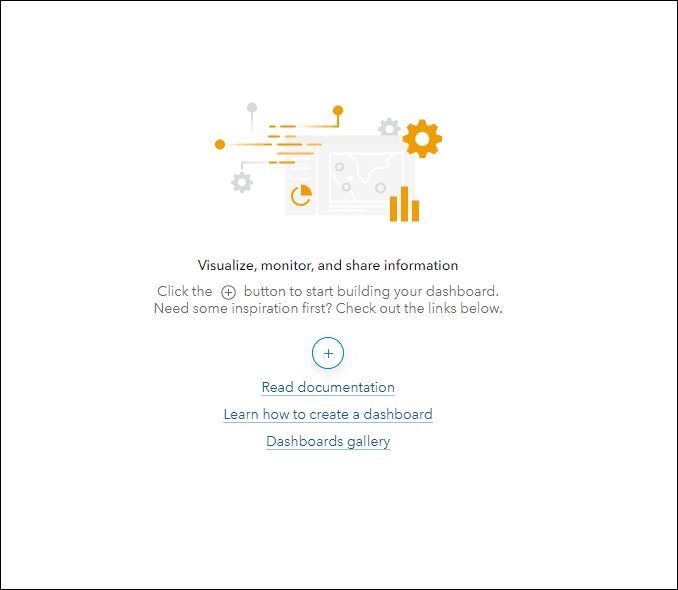
To create a new dashboard:
-
Click on the Create app > Dashboard in your organization. Alternatively, click the App launcher button
 > Dashboards.
 -
In the Create new dashboard window, provide a title for your new dashboard.
-
Click Create dashboard.
The dashboard opens for editing, and you can begin configuring your dashboard.
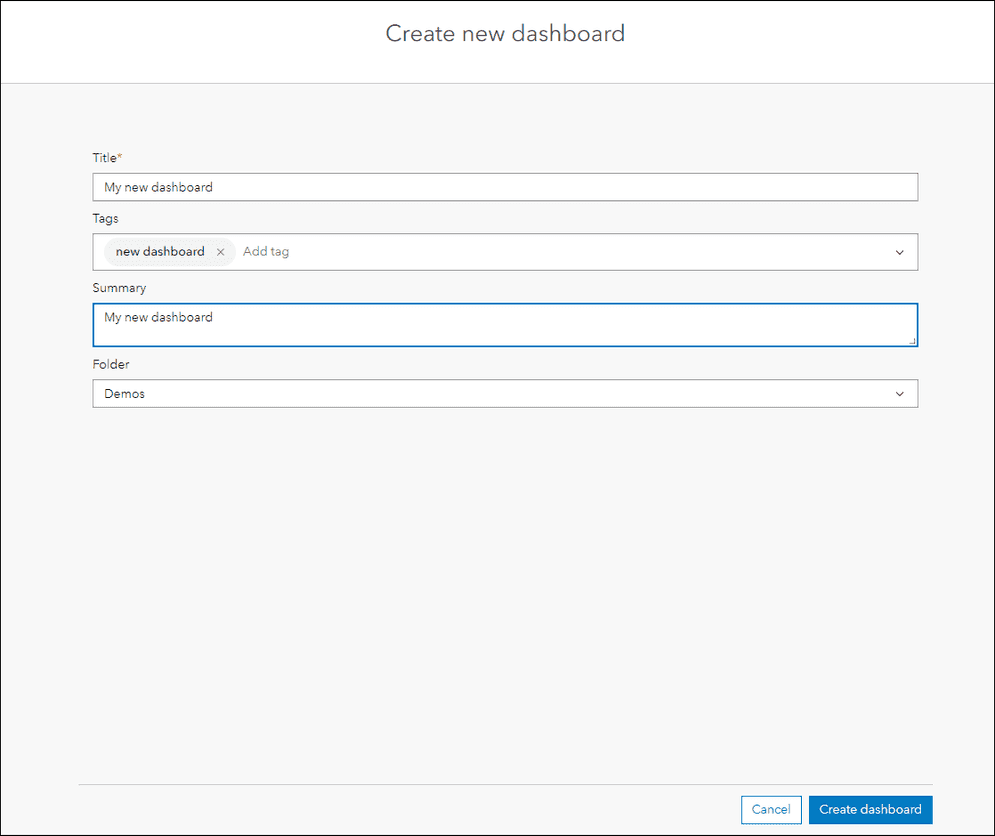
Enter values in the required fields to create a new dashboard.
3. Configure the dashboard
Configuring a dashboard involves selecting a view, adding elements, connecting to data sources, and applying filters.
A layout of a dashboard view is an arrangement of various elements that make up a dashboard. These elements include maps, charts, lists, tables, gauges, images, and text that display data. These elements are organized on the dashboard page, where you can customize each element's size and position.
You can create a dashboard for desktop and configure it for different mobile devices. The mobile views can include the same dashboard elements as the desktop view. Depending on the mobile view size, you can add or remove these elements to fit different screen sizes.
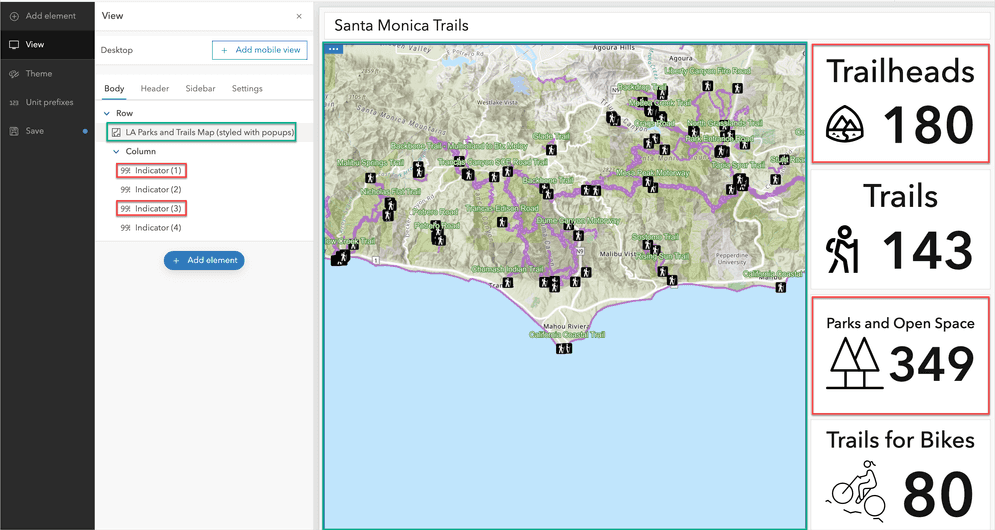
Customize the experience of your dashboard for desktop or mobile view.
Add elements
To add elements to your new empty dashboard, follow the steps below.
-
Click Add element button.
-
Choose an element from the list.
-
Configure the selected element.
Connect data sources
ArcGIS Dashboards support a variety of data sources that allow you to create informative and visually appealing dashboards. Dashboard elements allows you to curate data from various sources like your ArcGIS organization or ArcGIS Living Atlas. Data-driven elements, such as maps, serial charts, and indicators, can connect to data sources include web map layers, layers stored in your organization, or feature sets generated using data expressions written in Arcade.
Filter data
ArcGIS Dashboards provides filters to help you refine and highlight specific aspects of your data. When configuring an element in a dashboard, you can apply one or more filter conditions to limit the display data by configuring filter conditions.
Filter conditions are queries used to search or select records from a database table or hosted feature layer. These conditions are constructed using Structured Query language (SQL) syntax to create these search criteria. Dashboards elements support basic and advanced SQL WHERE clauses, allowing you filter data based on more than one condition.
4. Share the dashboard
Once you have created and configured your dashboard, you can share your dashboard with specific users, groups, or the public. You can also embed your dashboard in a website or a blog.
-
Click Home > Dashboards.
-
In My dashboards tab, click Item details. Your dashboard's item details page will be displayed.
-
Click Share.
Tutorials
Create a dashboard
Create your first dashboard using ArcGIS Dashboards.
ArcGIS Online

Format data in your dashboard
Use Arcade in ArcGIS Dashboards to apply simple formatting to enhance data visualization.
ArcGIS Online
Advanced formatting in ArcGIS Dashboards
Use Arcade and HTML to derive new information and display alerts in a dashboard.
ArcGIS Online