In order to create effective web apps with app builders, you first need to prepare data. In most cases you will use your own data, but you can also use existing data hosted in ArcGIS, such as in ArcGIS Living Atlas of the World.
There are a number of ways you can prepare data for analysis, but the easiest way is to use ArcGIS software and tools such as ArcGIS Online, Map Viewer, and ArcGIS Pro. This page explains the high-level steps to prepare data by hosting it in your ArcGIS organization and styling it with the Map Viewer.
Steps
The general steps for preparing your data:
1. Import your data
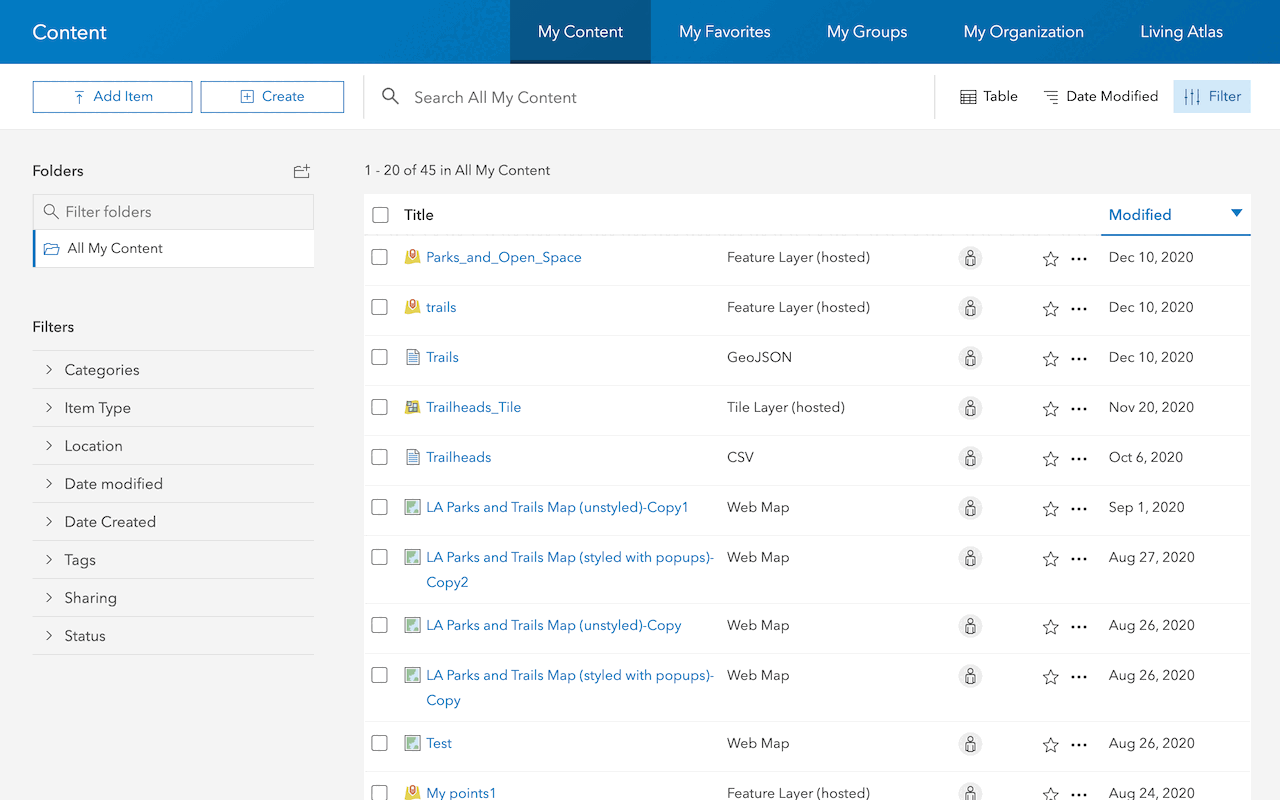
You can import existing data into your portal. This will allow you to use the imported data in your web apps and share it with other users.
Hosted feature layer
You can use the tools in your portal to create a hosted feature layer. A feature layer is used to store features that contain a geometry and attributes. After a feature layer is created, applications can access it by ID or URL and in order to query, edit, and display features.
2. Create a web map
A web map is a map created with the Map Viewer that can be used in your web apps.
The Map Viewer allows you to interactively style and configure maps by setting the basemap layer, data layers, layer styles, pop-up settings, and layer visibility ranges. The resulting map settings are stored as JSON in an item. A number of ArcGIS apps can access web map items, read the JSON, and then re-create the original scene.
Map Viewer
The Map Viewer allows you to create interactive a web map you can share in your ArcGIS organization. It also allows you to:
- Navigate the map to view selected areas.
- Click features on the map to view information in pop-ups.
- Rotate the map to display a new vantage point.
3. Style your layers in a web map
Maps allow you to visualize data in a variety of ways. For example, you can visualize population data for countries as a sequence of colors, such as from light to dark, or as proportional circles, such as from small to large. This flexibility allows you to tell different stories and discover hidden patterns depending on how the data is presented. However, because the process of creating a map is so flexible, you must make decisions when there is not always the best answer.
Tutorials
Use tools to create different types of content and build low-code/no-code applications.
Import data as a feature layer
Use data management tools to import and create hosted feature layers.
ArcGIS Online Location Platform dashboard

Create a web map
Use Map Viewer to create a web map for your application.
Map Viewer

Style layers in a web map
Use Map Viewer to style layers in a web map.
ArcGIS Online Map Viewer
Tools
Use tools to access the ArcGIS organization and create and manage content for low-code/no-code applications.