import FlowRenderer from "@arcgis/core/renderers/FlowRenderer.js";const FlowRenderer = await $arcgis.import("@arcgis/core/renderers/FlowRenderer.js");- Inheritance:
- FlowRenderer→
Accessor
- Since
- ArcGIS Maps SDK for JavaScript 4.23
The FlowRenderer allows you to visualize your raster data with animated streamlines. This renderer can be used to visualize flow direction and magnitude information for meteorology and oceanography raster data.
To use this renderer, the source type of your raster dataset must be Vector-UV or Vector-MagDir.
The direction of the raster defines the direction of movement, and the magnitude defines the visible length of the streamline.
Streamline animation
The final visuals are influenced by several key properties that control the behavior of the animated streamlines. In particular, the speed and length of the flow are defined by a combination of the properties flowSpeed, trailLength, and maxPathLength.
The FlowRenderer displays animated streamlines by moving a visible trail (in red) along a precomputed path, or streamline (in black). This path represents the full route of flow and is based on the direction of the underlying data.

The trail's length and speed are initially influenced by the magnitude of the source data. To give users more control, the following properties can be adjusted:
- The flowSpeed scales the trail's speed without changing its length.
- The trailLength controls how much of the path is visibly lit up at any moment, with higher values producing longer trails.
- The maxPathLength defines how far along the path the trail can travel before looping back, affecting the total journey but not the visible trail length.
When the source data has very low magnitudes, the animation may appear slow and the trail short (almost static). Increasing both the flowSpeed and trailLength can enhance visibility and motion. For example, flood simulations with magnitudes less than 5 m/s typically require trailLength values of around 1500 to produce better visuals.
Known Limitations
The FlowRenderer is only supported with ImageryTileLayer and ImageryLayer.
Example
const renderer = new FlowRenderer({ density: 1, color: [50, 120, 240], // blue flowSpeed: 10, trailWidth: "2px"});Constructors
Constructor
Parameters
| Parameter | Type | Description | Required |
|---|---|---|---|
| properties | | |
Example
let renderer = { type: "flow", color: [50, 120, 240, 1]}Properties
| Property | Type | Class |
|---|---|---|
| | ||
| | ||
declaredClass readonly inherited | ||
| | ||
"flow-from" | "flow-to" | | |
| | ||
| | ||
| | ||
"butt" | "round" | | |
| | ||
| | ||
type readonly | "flow" | |
VisualVariable[] | null | undefined | |
authoringInfo
- Type
- AuthoringInfo
Contains metadata about renderers generated from the flowRendererCreator.createRenderer() method, including information for setting UI elements such as sliders and themes. This allows the authoring clients to save specific overridable settings so user selections can be remembered the next time they are accessed via the UI.
density
- Type
- number
The density of the streamlines. This value determines how many streamlines appear in the visualization:
- A value less than or equal to 0 means no streamlines will be rendered.
- Values between 0 and 1 reduce the number of streamlines.
- Values greater than 1 increase the number of streamlines proportionally.
Notes
While density can exceed 1, the effective maximum number of streamlines is constrained by factors such as screen size and trailLength property. At high densities, new streamlines may be discarded to avoid cluttered visualizations and excessive computation time.
density = 0.1 | density = 1 | density = 1.5 |
|---|---|---|
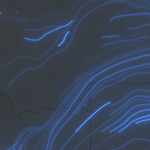 | 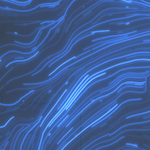 | 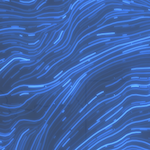 |
- Default value
- 0.8
flowRepresentation
- Type
- "flow-from" | "flow-to"
Defines the flow direction of the data. This can be modified to display meteorological (the direction it is flowing from) or climatological data (the direction it is flowing to).
| Value | Description | Example |
|---|---|---|
| flow-from | Flow from angle. | 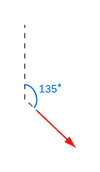 |
| flow-to | Flow to angle. | 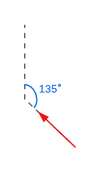 |
- Default value
- "flow-from"
flowSpeed
- Type
- number
The speed of the animated trails that travel along the streamlines, relative to the simulation time. This property does not change the length of the trails or streamlines, only the speed at which the trail is animated. The final speed is initially based on the magnitude from the underlying data and is then further scaled by this property. A speed of 0 will result in no animation.
- See also
- Default value
- 10
legendOptions
- Type
- RendererLegendOptions | null | undefined
An object providing options for displaying the renderer in the Legend.
Example
renderer.legendOptions = { title: "Wind speed", order: "descending-values",}; maxPathLength
- Type
- number
The maximum path length of the streamlines on which the trail travels in number of points.
The trail is the visible and animated portion that travels along the streamline.
The actual length of the trail depends on the magnitude coming from the raster layer and the defined trailLength.
During the course of the animation, the trail will travel to reach the path length defined here, then
will restart. This value may be autocast with a string expressing size in points or pixels (e.g. 100px).
- See also
- Default value
- 200
Examples
// width in pointsflowRenderer.maxPathLength = 100;// width in pixelsflowRenderer.maxPathLength = "200px";// width in pointsflowRenderer.maxPathLength = "100pt"; trailCap
- Type
- "butt" | "round"
- Since
- ArcGIS Maps SDK for JavaScript 4.24
The front cap of the streamline. A round cap will only be applied if trailWidth is greater than 4px or 3pt.
Known Limitations
The round trail cap is not supported in 3D SceneView.
- Default value
- "butt"
trailLength
- Type
- number
The approximate visible length of the trail that travels along the streamline. The streamlines maintain their total length, only the visible trail is changed. The actual trail length is first based on the data, then further scaled by this property.
trailLength = 20 | trailLength = 100 | trailLength = 250 |
|---|---|---|
 |  |  |
- See also
- Default value
- 100
trailWidth
- Type
- number
The width of the streamline trail in points. This value may be autocast with a string
expressing size in points or pixels (e.g. 3px).
- Default value
- 1.5
Examples
// width in pointsflowRenderer.trailWidth = 4;// width in pixelsflowRenderer.trailWidth = "2px";// width in pointsflowRenderer.trailWidth = "4pt"; visualVariables
- Type
- VisualVariable[] | null | undefined
An array of VisualVariable objects.
Each object must indicate
the type of visual variable to apply (e.g. ColorVisualVariable), the numeric
field from which to drive the visualization, and the visual values to map to the data.
The following list identifies each visual variable type that is supported with the FlowRenderer and provides a link to the specification table
of each: ColorVisualVariable,
OpacityVisualVariable, and SizeVisualVariable.
SizeVisualVariable will update the trailWidth property.
When setting fields for the visual variables set on the FlowRenderer, use the Magnitude field. Magnitude will return pixel values from the
first band. If the data represents u (zonal) and v (meridional) speed components, values are automatically converted
to Magnitude and Direction.
The RotationVariable is not supported on the FlowRenderer since the direction of the flow is already encoded in the underlying data.
- See also
Example
const renderer = new FlowRenderer({ visualVariables: [{ type: "color", field: "Magnitude", stops: [ { value: 3, color: "#0080ff" }, { value: 15, color: "#00ff00" } ] }, { type: "opacity", field: "Magnitude", stops: [ { value: 1, opacity: 0.5 }, { value: 8, opacity: 1 } ] }]});Methods
fromJSON
- Signature
-
fromJSON (json: any): any
Creates a new instance of this class and initializes it with values from a JSON object
generated from an ArcGIS product. The object passed into the input json
parameter often comes from a response to a query operation in the REST API or a
toJSON()
method from another ArcGIS product. See the Using fromJSON()
topic in the Guide for details and examples of when and how to use this function.
Parameters
| Parameter | Type | Description | Required |
|---|---|---|---|
| json | A JSON representation of the instance in the ArcGIS format. See the ArcGIS REST API documentation for examples of the structure of various input JSON objects. | |
- Returns
- any
Returns a new instance of this class.
clone
- Signature
-
clone (): FlowRenderer
Creates a deep clone of the renderer.
- Returns
- FlowRenderer
Example
// Creates a deep clone of the first layer's rendererlet renderer = view.map.layers.at(0).renderer.clone(); toJSON
- Signature
-
toJSON (): any
Converts an instance of this class to its ArcGIS portal JSON representation. See the Using fromJSON() guide topic for more information.
- Returns
- any
The ArcGIS portal JSON representation of an instance of this class.