import VectorFieldRenderer from "@arcgis/core/renderers/VectorFieldRenderer.js";const VectorFieldRenderer = await $arcgis.import("@arcgis/core/renderers/VectorFieldRenderer.js");- Inheritance:
- VectorFieldRenderer→
Accessor
- Since
- ArcGIS Maps SDK for JavaScript 4.17
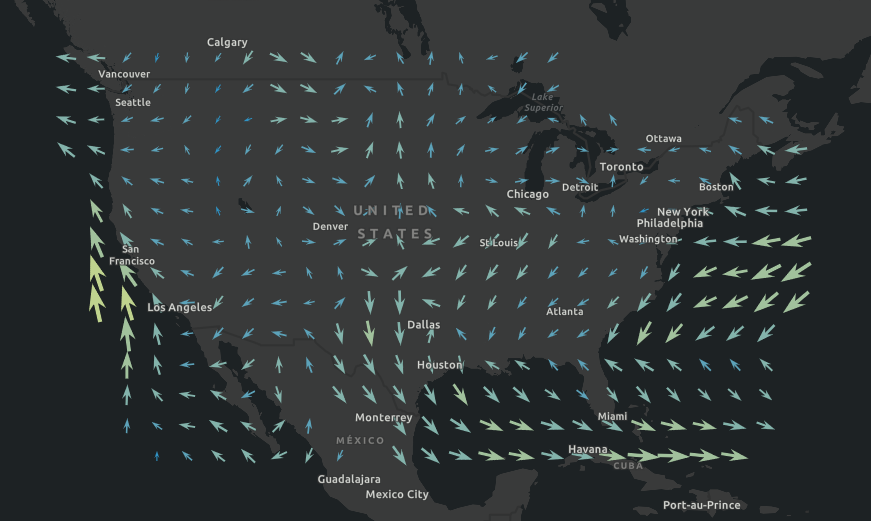
The VectorFieldRenderer allows you to display your raster data with vector symbols. This renderer is often used for visualizing flow direction and magnitude information in meteorology and oceanography raster data. It can also be used to symbolize a single raster layer where the symbols are scalar. The direction of the raster defines the angles, while the magnitude of the raster defines the size of the symbol.
Known Limitations
The VectorFieldRenderer is only supported with ImageryLayer and ImageryTileLayer. The VectorFieldRenderer is only supported in 2D MapView. The visualVariables set on the VectorFieldRenderer are not supported in the Legend.
Example
const renderer = new VectorFieldRenderer({ style: "beaufort-kn", // Beaufort point symbol (knots) flowRepresentation: "flow-from", // show flow to angle for wind direction symbolTileSize: 10, // draw one symbol in every 10x10 pixels visualVariables: [ { type: "size", field: "Magnitude", // values read from the first band maxDataValue: 32, maxSize: "100px", minDataValue: 0.04, minSize: "8px" }, { type: "rotation", field: "Direction", // values read from the second band rotationType: "geographic" } ]});Constructors
Constructor
Parameters
| Parameter | Type | Description | Required |
|---|---|---|---|
| properties | | |
Properties
| Property | Type | Class |
|---|---|---|
"Magnitude" | | |
declaredClass readonly inherited | ||
"flow-from" | "flow-to" | | |
| | ||
| | ||
| | ||
| | ||
type readonly | "vector-field" | |
VisualVariable[] | null | undefined | |
flowRepresentation
- Type
- "flow-from" | "flow-to"
Defines the flow direction of the data. If you have a data showing wind direction, it is recommended to use flow-to to show the natural flow direction
of the wind on the map.
| Value | Description |
|---|---|
| flow-from | VectorFieldRenderer symbol style point towards the direction of the data. |
| flow-to | VectorFieldRenderer symbol style point to the opposite direction of the data. |
- Default value
- "flow-from"
style
- Type
- VectorFieldStyles
Predefined symbol styles used to represent the vector flow.
| Value | Description |
|---|---|
| beaufort-ft | Beaufort point symbol (feet) |
| beaufort-km | Beaufort point symbol (kilometers) |
| beaufort-kn | Beaufort point symbol (knots) |
| beaufort-m | Beaufort point symbol (meters) |
| beaufort-mi | Beaufort point symbol (miles) |
| classified-arrow | Classified arrow point symbol |
| ocean-current-kn | Ocean current point symbol (knots) |
| ocean-current-m | Ocean current point symbol (meters) |
| simple-scalar | Simple scalar point symbol |
| single-arrow | Single arrow point symbol |
| wind-barb | Barb wind speed point symbol |
- Default value
- "single-arrow"
symbolTileSize
- Type
- number
Determines the density of the symbols. Larger tile size, fewer symbols. The VectorFieldRenderer draws one symbol within a defined tile size (in screen pixels).
- Default value
- 50
visualVariables
- Type
- VisualVariable[] | null | undefined
An array of VisualVariable objects. Each object must indicate the type of visual variable to apply (e.g. SizeVisualVariable, RotationVisualVariable), the numeric field or expression from which to drive the visualization, and the visual values to map to the data.
When setting fields for the visual variables set on the VectorFieldRenderer, use Magnitude and Direction fields. Magnitude will return pixel values from the
first band. Direction will return values from the second band. If the data represents u (zonal) and v (meridional) speed components, values are automatically converted
to Magnitude and Direction.
Example
const renderer = new VectorFieldRenderer({ style: "beaufort-kn", // Beaufort point symbol (knots) flowRepresentation: "flow-from", // show flow to angle for wind direction symbolTileSize: 10, // controls the density of the displayed vector symbols. visualVariables: [ { type: "size", field: "Magnitude", // values read from the first band maxDataValue: 32, maxSize: "100px", minDataValue: 0.04, minSize: "8px" }, { type: "rotation", field: "Direction", // values read from the second band rotationType: "geographic" } ]});Methods
fromJSON
- Signature
-
fromJSON (json: any): any
Creates a new instance of this class and initializes it with values from a JSON object
generated from an ArcGIS product. The object passed into the input json
parameter often comes from a response to a query operation in the REST API or a
toJSON()
method from another ArcGIS product. See the Using fromJSON()
topic in the Guide for details and examples of when and how to use this function.
Parameters
| Parameter | Type | Description | Required |
|---|---|---|---|
| json | A JSON representation of the instance in the ArcGIS format. See the ArcGIS REST API documentation for examples of the structure of various input JSON objects. | |
- Returns
- any
Returns a new instance of this class.
clone
- Signature
-
clone (): VectorFieldRenderer
Creates a deep clone of the renderer.
- Returns
- VectorFieldRenderer
A deep clone of the object that invoked this method.
Example
// Creates a deep clone of the first layer's rendererlet renderer = view.map.layers.at(0).renderer.clone(); toJSON
- Signature
-
toJSON (): any
Converts an instance of this class to its ArcGIS portal JSON representation. See the Using fromJSON() guide topic for more information.
- Returns
- any
The ArcGIS portal JSON representation of an instance of this class.