import type { VisualVariablesMixin } from "@arcgis/core/renderers/mixins/VisualVariablesMixin.js";- Subclasses:
- ClassBreaksRenderer, DictionaryRenderer, DotDensityRenderer, FlowRenderer, PieChartRenderer, SimpleRenderer, UniqueValueRenderer, VectorFieldRenderer
Properties
| Property | Type | Class |
|---|---|---|
VisualVariable[] | null | undefined | |
visualVariables
- Type
- VisualVariable[] | null | undefined
An array of VisualVariable objects. Each object must indicate the type of visual variable to apply (e.g. ColorVisualVariable, SizeVisualVariable, OpacityVisualVariable, RotationVisualVariable), the numeric field or expression from which to drive the visualization, and the visual values to map to the data. The following list identifies each visual variable type and provides a link to the specification table of each.
| Type | Object Specification | Legend Example |
|---|---|---|
| color | ColorVisualVariable |  |
| size | SizeVisualVariable |  |
| opacity | OpacityVisualVariable |  |
| rotation | RotationVisualVariable | - |
Visual variables are primarily be used in two ways.
1. Thematic mapping
In most cases, visual variables are used to create visualizations based on a thematic attribute (e.g. population, education, rank, money, magnitude, etc.) in either 2D or 3D.
renderer.visualVariables = [{ type: "size", field: "POP_POVERTY", normalizationField: "TOTPOP_CY", legendOptions: { title: "% population in poverty by county" }, stops: [ { value: 0.15, size: 4, label: "<15%" }, { value: 0.25, size: 12, label: "25%" }, { value: 0.35, size: 24, label: ">35%" } ]}];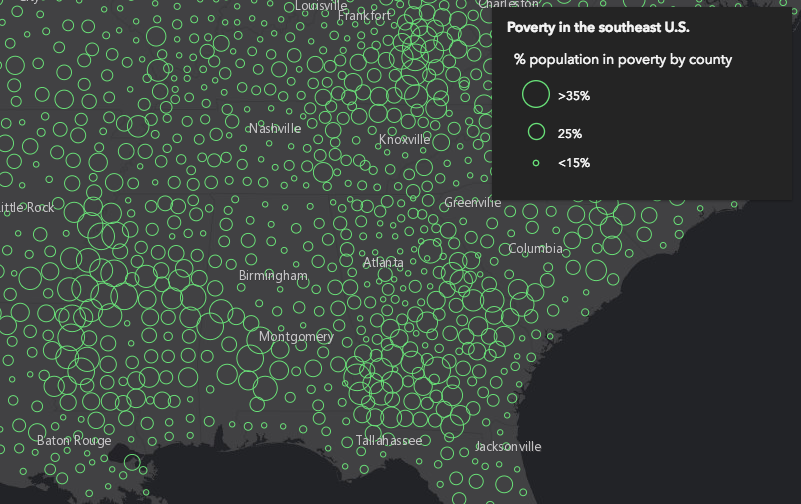
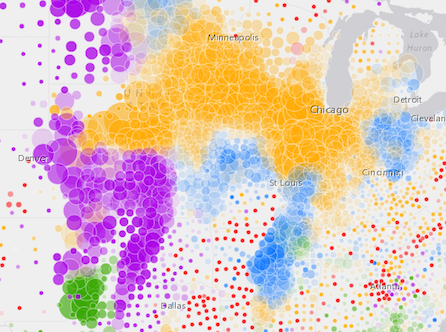
You can take the visualization a step further and use multiple visual variables in the same renderer. The sample below uses three visual variables (size, color, and opacity).
2. Mapping real-world sizes
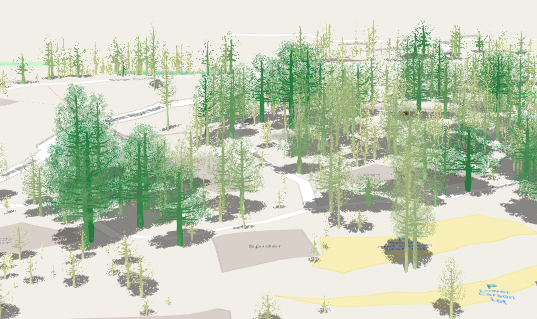
The size visual variable can be used to visualize the true sizes of features (e.g. tree canopy, road width, building height, etc.) based on their size in the real world. This can be particularly powerful when working in a 3D SceneView. The image below shows a layer of trees that uses visual variables to size each feature to the true dimensions of each tree based on data stored in multiple attribute fields.
See the Thematic visualization with realistic 3D symbols for an example of using multiple visual variables to visualize your data.
Known Limitations
Color and opacity visual variables must not have more than 8 stops and size visual variables must not have more than 6 stops. This does not apply to variables driven by view scale.
For apps where users can interactively change the field or valueExpression of a visual variable, we suggest
you include all potential fields referenced by visual variables in the FeatureLayer.outFields
of the layer. This ensures the best user experience when switching or updating fields in renderers.
- See also