Query demographic data
Learn how to query demographic information for locations around the world with the GeoEnrichment service.
The GeoEnrichment service provides information such as population and household size about geographic areas that you define. The enrich
method provides the ability to get facts about a location or area. Using Enrich, you can get information about the people, places, and businesses in a specific area or within a certain distance of a point.
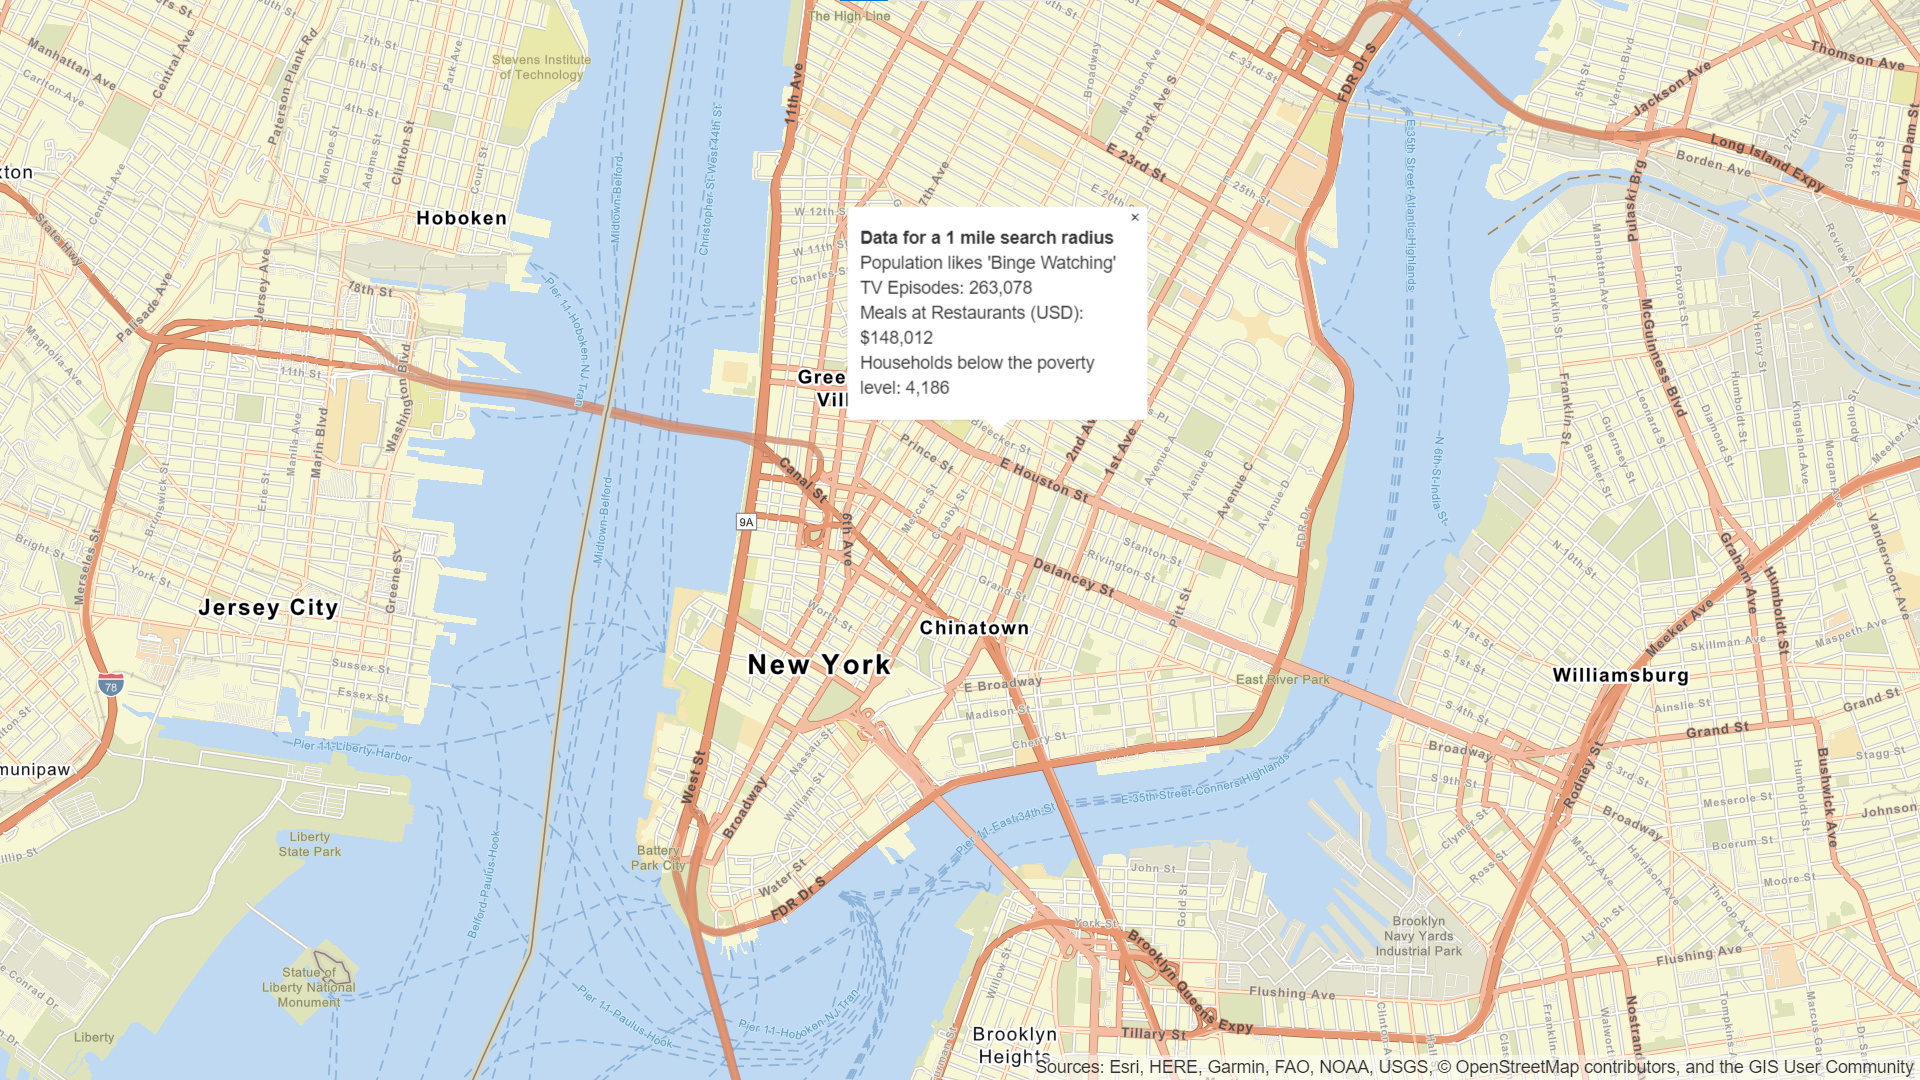
In this tutorial, you use ArcGIS REST JS to access the GeoEnrichment service to search for demographic data within one mile of a clicked point and display the data in a overlay panel.
Prerequisites
You need a free ArcGIS developer account to access your dashboard and API keys. The API key must be scoped to access the services used in this tutorial.
Steps
Create a new pen
- To get started, either complete the Display a map tutorial or .
Set the API key
To access ArcGIS location services, you need an API key.
Go to your dashboard to get an API key.
In CodePen, update
apiKey
to use your key.Change line const apiKey = "YOUR-API-KEY"; const basemapId = "ArcGIS:Streets"; const basemapURL = "https://basemaps-api.arcgis.com/arcgis/rest/services/styles/" + basemapId + "?type=style&apiKey=" + apiKey; olms(map, basemapURL);
Add references to ArcGIS REST JS
This tutorial uses ArcGIS REST JS to access the geoenrichment service. It also uses the ol-popup library to display pop-ups.
Add links to the ArcGIS REST JS and ol-popup libraries in the
<script>
section.Add line. Add line. Add line. Add line. Add line. <!DOCTYPE html> <html> <head> <meta charset="utf-8"> <meta name="viewport" content="initial-scale=1, maximum-scale=1, user-scalable=no" /> <title>OpenLayers Tutorials: Get Demographic Data</title> <style> html, body, #map { padding: 0; margin: 0; height: 100%; width: 100%; font-family: Arial, Helvetica, sans-serif; font-size: 14px; color: #323232; } #map canvas { cursor: crosshair; } </style> <link rel="stylesheet" href="https://cdn.jsdelivr.net/gh/openlayers/openlayers.github.io@master/en/v6.4.3/css/ol.css" type="text/css" /> <script src="https://cdn.jsdelivr.net/gh/openlayers/openlayers.github.io@master/en/v6.4.3/build/ol.js"></script> <script src="https://cdn.jsdelivr.net/npm/ol-mapbox-style@6.1.4/dist/olms.js" type="text/javascript"></script> <script src="https://unpkg.com/@esri/arcgis-rest-request@3.0.0/dist/umd/request.umd.js"></script> <script src="https://unpkg.com/ol-popup@4.0.0"></script> <script src="https://unpkg.com/@esri/arcgis-rest-auth@3.0.0/dist/umd/auth.umd.js"></script> <link rel="stylesheet" href="https://unpkg.com/ol-popup@4.0.0/src/ol-popup.css" /> <script src="https://unpkg.com/@esri/arcgis-rest-demographics@3.0.0/dist/umd/demographics.umd.js"></script> </head> <body> <div id="map"></div> <script> const apiKey = "YOUR-API-KEY"; const map = new ol.Map({ target: "map" }); map.setView( new ol.View({ center: ol.proj.fromLonLat([18.88, 47.33]), zoom: 5 }) ); const basemapId = "ArcGIS:Navigation"; const basemapURL = "https://basemaps-api.arcgis.com/arcgis/rest/services/styles/" + basemapId + "?type=style&apiKey=" + apiKey; olms(map, basemapURL).then(function (map) { const popup = new Popup(); map.addOverlay(popup); map.on('click', (event) => { const lonLat = ol.proj.toLonLat(event.coordinate); const authentication = new arcgisRest.ApiKey({ key: apiKey }); arcgisRest.queryDemographicData({ studyAreas: [{ "geometry": { "x": lonLat[0], "y": lonLat[1] } }], authentication: authentication }) .then((response) => { const data = document.getElementById("data"); const featureSet = response.results[0].value.FeatureSet; let message; if (featureSet.length > 0 && featureSet[0].features.length > 0) { const attributes = featureSet[0].features[0].attributes; message = `<b>Data for a 1 mile search radius</b>` + [ `<br>Population: ${attributes.TOTPOP}`, `Males: ${attributes.TOTMALES} `, `Females: ${attributes.TOTFEMALES}`, `Average Household Size: ${attributes.AVGHHSZ}` ].join('<br>') } else { message = "Data not available for this location."; } popup.show(event.coordinate, message); }); }); }); </script> </body> </html>
Update the map
The GeoEnrichment service has data sources for many countries around the world, including most of Europe. Update the position of the map to center on eastern Europe and the basemapId
.
Update the
center
parameter to[18.88, 47.33]
and setzoom
to 5.Change line Change line <!DOCTYPE html> <html> <head> <meta charset="utf-8"> <meta name="viewport" content="initial-scale=1, maximum-scale=1, user-scalable=no" /> <title>OpenLayers Tutorials: Get Demographic Data</title> <style> html, body, #map { padding: 0; margin: 0; height: 100%; width: 100%; font-family: Arial, Helvetica, sans-serif; font-size: 14px; color: #323232; } #map canvas { cursor: crosshair; } </style> <link rel="stylesheet" href="https://cdn.jsdelivr.net/gh/openlayers/openlayers.github.io@master/en/v6.4.3/css/ol.css" type="text/css" /> <script src="https://cdn.jsdelivr.net/gh/openlayers/openlayers.github.io@master/en/v6.4.3/build/ol.js"></script> <script src="https://cdn.jsdelivr.net/npm/ol-mapbox-style@6.1.4/dist/olms.js" type="text/javascript"></script> <script src="https://unpkg.com/@esri/arcgis-rest-request@3.0.0/dist/umd/request.umd.js"></script> <script src="https://unpkg.com/ol-popup@4.0.0"></script> <script src="https://unpkg.com/@esri/arcgis-rest-auth@3.0.0/dist/umd/auth.umd.js"></script> <link rel="stylesheet" href="https://unpkg.com/ol-popup@4.0.0/src/ol-popup.css" /> <script src="https://unpkg.com/@esri/arcgis-rest-demographics@3.0.0/dist/umd/demographics.umd.js"></script> </head> <body> <div id="map"></div> <script> const apiKey = "YOUR-API-KEY"; const map = new ol.Map({ target: "map" }); map.setView( new ol.View({ center: ol.proj.fromLonLat([18.88, 47.33]), zoom: 5 }) ); const basemapId = "ArcGIS:Navigation"; const basemapURL = "https://basemaps-api.arcgis.com/arcgis/rest/services/styles/" + basemapId + "?type=style&apiKey=" + apiKey; olms(map, basemapURL).then(function (map) { const popup = new Popup(); map.addOverlay(popup); map.on('click', (event) => { const lonLat = ol.proj.toLonLat(event.coordinate); const authentication = new arcgisRest.ApiKey({ key: apiKey }); arcgisRest.queryDemographicData({ studyAreas: [{ "geometry": { "x": lonLat[0], "y": lonLat[1] } }], authentication: authentication }) .then((response) => { const data = document.getElementById("data"); const featureSet = response.results[0].value.FeatureSet; let message; if (featureSet.length > 0 && featureSet[0].features.length > 0) { const attributes = featureSet[0].features[0].attributes; message = `<b>Data for a 1 mile search radius</b>` + [ `<br>Population: ${attributes.TOTPOP}`, `Males: ${attributes.TOTMALES} `, `Females: ${attributes.TOTFEMALES}`, `Average Household Size: ${attributes.AVGHHSZ}` ].join('<br>') } else { message = "Data not available for this location."; } popup.show(event.coordinate, message); }); }); }); </script> </body> </html>
Update the
basemapId
toArcGIS:Navigation
.Change line <!DOCTYPE html> <html> <head> <meta charset="utf-8"> <meta name="viewport" content="initial-scale=1, maximum-scale=1, user-scalable=no" /> <title>OpenLayers Tutorials: Get Demographic Data</title> <style> html, body, #map { padding: 0; margin: 0; height: 100%; width: 100%; font-family: Arial, Helvetica, sans-serif; font-size: 14px; color: #323232; } #map canvas { cursor: crosshair; } </style> <link rel="stylesheet" href="https://cdn.jsdelivr.net/gh/openlayers/openlayers.github.io@master/en/v6.4.3/css/ol.css" type="text/css" /> <script src="https://cdn.jsdelivr.net/gh/openlayers/openlayers.github.io@master/en/v6.4.3/build/ol.js"></script> <script src="https://cdn.jsdelivr.net/npm/ol-mapbox-style@6.1.4/dist/olms.js" type="text/javascript"></script> <script src="https://unpkg.com/@esri/arcgis-rest-request@3.0.0/dist/umd/request.umd.js"></script> <script src="https://unpkg.com/ol-popup@4.0.0"></script> <script src="https://unpkg.com/@esri/arcgis-rest-auth@3.0.0/dist/umd/auth.umd.js"></script> <link rel="stylesheet" href="https://unpkg.com/ol-popup@4.0.0/src/ol-popup.css" /> <script src="https://unpkg.com/@esri/arcgis-rest-demographics@3.0.0/dist/umd/demographics.umd.js"></script> </head> <body> <div id="map"></div> <script> const apiKey = "YOUR-API-KEY"; const map = new ol.Map({ target: "map" }); map.setView( new ol.View({ center: ol.proj.fromLonLat([18.88, 47.33]), zoom: 5 }) ); const basemapId = "ArcGIS:Navigation"; const basemapURL = "https://basemaps-api.arcgis.com/arcgis/rest/services/styles/" + basemapId + "?type=style&apiKey=" + apiKey; olms(map, basemapURL).then(function (map) { const popup = new Popup(); map.addOverlay(popup); map.on('click', (event) => { const lonLat = ol.proj.toLonLat(event.coordinate); const authentication = new arcgisRest.ApiKey({ key: apiKey }); arcgisRest.queryDemographicData({ studyAreas: [{ "geometry": { "x": lonLat[0], "y": lonLat[1] } }], authentication: authentication }) .then((response) => { const data = document.getElementById("data"); const featureSet = response.results[0].value.FeatureSet; let message; if (featureSet.length > 0 && featureSet[0].features.length > 0) { const attributes = featureSet[0].features[0].attributes; message = `<b>Data for a 1 mile search radius</b>` + [ `<br>Population: ${attributes.TOTPOP}`, `Males: ${attributes.TOTMALES} `, `Females: ${attributes.TOTFEMALES}`, `Average Household Size: ${attributes.AVGHHSZ}` ].join('<br>') } else { message = "Data not available for this location."; } popup.show(event.coordinate, message); }); }); }); </script> </body> </html>
Add a click event handler
You need a location before calling the GeoEnrichment service. To get a location, you can add a handler to the Map
's click
event. The click handler will be called with an object containing a Coordinate
.
You can change the mouse cursor to a crosshair to make it easier to click precisely. Modify the CSS style of its canvas
element to do this.
In the
<style>
, set the mouse cursor style tocrosshair
.Add line. Add line. Add line. <!DOCTYPE html> <html> <head> <meta charset="utf-8"> <meta name="viewport" content="initial-scale=1, maximum-scale=1, user-scalable=no" /> <title>OpenLayers Tutorials: Get Demographic Data</title> <style> html, body, #map { padding: 0; margin: 0; height: 100%; width: 100%; font-family: Arial, Helvetica, sans-serif; font-size: 14px; color: #323232; } #map canvas { cursor: crosshair; } </style> <link rel="stylesheet" href="https://cdn.jsdelivr.net/gh/openlayers/openlayers.github.io@master/en/v6.4.3/css/ol.css" type="text/css" /> <script src="https://cdn.jsdelivr.net/gh/openlayers/openlayers.github.io@master/en/v6.4.3/build/ol.js"></script> <script src="https://cdn.jsdelivr.net/npm/ol-mapbox-style@6.1.4/dist/olms.js" type="text/javascript"></script> <script src="https://unpkg.com/@esri/arcgis-rest-request@3.0.0/dist/umd/request.umd.js"></script> <script src="https://unpkg.com/ol-popup@4.0.0"></script> <script src="https://unpkg.com/@esri/arcgis-rest-auth@3.0.0/dist/umd/auth.umd.js"></script> <link rel="stylesheet" href="https://unpkg.com/ol-popup@4.0.0/src/ol-popup.css" /> <script src="https://unpkg.com/@esri/arcgis-rest-demographics@3.0.0/dist/umd/demographics.umd.js"></script> </head> <body> <div id="map"></div> <script> const apiKey = "YOUR-API-KEY"; const map = new ol.Map({ target: "map" }); map.setView( new ol.View({ center: ol.proj.fromLonLat([18.88, 47.33]), zoom: 5 }) ); const basemapId = "ArcGIS:Navigation"; const basemapURL = "https://basemaps-api.arcgis.com/arcgis/rest/services/styles/" + basemapId + "?type=style&apiKey=" + apiKey; olms(map, basemapURL).then(function (map) { const popup = new Popup(); map.addOverlay(popup); map.on('click', (event) => { const lonLat = ol.proj.toLonLat(event.coordinate); const authentication = new arcgisRest.ApiKey({ key: apiKey }); arcgisRest.queryDemographicData({ studyAreas: [{ "geometry": { "x": lonLat[0], "y": lonLat[1] } }], authentication: authentication }) .then((response) => { const data = document.getElementById("data"); const featureSet = response.results[0].value.FeatureSet; let message; if (featureSet.length > 0 && featureSet[0].features.length > 0) { const attributes = featureSet[0].features[0].attributes; message = `<b>Data for a 1 mile search radius</b>` + [ `<br>Population: ${attributes.TOTPOP}`, `Males: ${attributes.TOTMALES} `, `Females: ${attributes.TOTFEMALES}`, `Average Household Size: ${attributes.AVGHHSZ}` ].join('<br>') } else { message = "Data not available for this location."; } popup.show(event.coordinate, message); }); }); }); </script> </body> </html>
Add a handler for the
click
event. Inside, convert the click coordinate to a longitude and latitude and save it in a variable.Add line. Add line. Add line. Add line. Add line. Add line. <!DOCTYPE html> <html> <head> <meta charset="utf-8"> <meta name="viewport" content="initial-scale=1, maximum-scale=1, user-scalable=no" /> <title>OpenLayers Tutorials: Get Demographic Data</title> <style> html, body, #map { padding: 0; margin: 0; height: 100%; width: 100%; font-family: Arial, Helvetica, sans-serif; font-size: 14px; color: #323232; } #map canvas { cursor: crosshair; } </style> <link rel="stylesheet" href="https://cdn.jsdelivr.net/gh/openlayers/openlayers.github.io@master/en/v6.4.3/css/ol.css" type="text/css" /> <script src="https://cdn.jsdelivr.net/gh/openlayers/openlayers.github.io@master/en/v6.4.3/build/ol.js"></script> <script src="https://cdn.jsdelivr.net/npm/ol-mapbox-style@6.1.4/dist/olms.js" type="text/javascript"></script> <script src="https://unpkg.com/@esri/arcgis-rest-request@3.0.0/dist/umd/request.umd.js"></script> <script src="https://unpkg.com/ol-popup@4.0.0"></script> <script src="https://unpkg.com/@esri/arcgis-rest-auth@3.0.0/dist/umd/auth.umd.js"></script> <link rel="stylesheet" href="https://unpkg.com/ol-popup@4.0.0/src/ol-popup.css" /> <script src="https://unpkg.com/@esri/arcgis-rest-demographics@3.0.0/dist/umd/demographics.umd.js"></script> </head> <body> <div id="map"></div> <script> const apiKey = "YOUR-API-KEY"; const map = new ol.Map({ target: "map" }); map.setView( new ol.View({ center: ol.proj.fromLonLat([18.88, 47.33]), zoom: 5 }) ); const basemapId = "ArcGIS:Navigation"; const basemapURL = "https://basemaps-api.arcgis.com/arcgis/rest/services/styles/" + basemapId + "?type=style&apiKey=" + apiKey; olms(map, basemapURL).then(function (map) { const popup = new Popup(); map.addOverlay(popup); map.on('click', (event) => { const lonLat = ol.proj.toLonLat(event.coordinate); const authentication = new arcgisRest.ApiKey({ key: apiKey }); arcgisRest.queryDemographicData({ studyAreas: [{ "geometry": { "x": lonLat[0], "y": lonLat[1] } }], authentication: authentication }) .then((response) => { const data = document.getElementById("data"); const featureSet = response.results[0].value.FeatureSet; let message; if (featureSet.length > 0 && featureSet[0].features.length > 0) { const attributes = featureSet[0].features[0].attributes; message = `<b>Data for a 1 mile search radius</b>` + [ `<br>Population: ${attributes.TOTPOP}`, `Males: ${attributes.TOTMALES} `, `Females: ${attributes.TOTFEMALES}`, `Average Household Size: ${attributes.AVGHHSZ}` ].join('<br>') } else { message = "Data not available for this location."; } popup.show(event.coordinate, message); }); }); }); </script> </body> </html>
Execute the query
You pass one or more study areas to arcgisRest.queryDemographicData
to specify the location of your query. To query a circular buffer around a point, pass a geometry
object with x
and y
parameters. The default search radius is one mile.
Inside the click handler, create a new
arcgisRest.ApiKey
to access the GeoEnrichment service. Call the service with an array containing a single geometry object containing the longitude and latitude, as thestudyAreas
parameter.Add line. Add line. Add line. Add line. Add line. Add line. Add line. Add line. <!DOCTYPE html> <html> <head> <meta charset="utf-8"> <meta name="viewport" content="initial-scale=1, maximum-scale=1, user-scalable=no" /> <title>OpenLayers Tutorials: Get Demographic Data</title> <style> html, body, #map { padding: 0; margin: 0; height: 100%; width: 100%; font-family: Arial, Helvetica, sans-serif; font-size: 14px; color: #323232; } #map canvas { cursor: crosshair; } </style> <link rel="stylesheet" href="https://cdn.jsdelivr.net/gh/openlayers/openlayers.github.io@master/en/v6.4.3/css/ol.css" type="text/css" /> <script src="https://cdn.jsdelivr.net/gh/openlayers/openlayers.github.io@master/en/v6.4.3/build/ol.js"></script> <script src="https://cdn.jsdelivr.net/npm/ol-mapbox-style@6.1.4/dist/olms.js" type="text/javascript"></script> <script src="https://unpkg.com/@esri/arcgis-rest-request@3.0.0/dist/umd/request.umd.js"></script> <script src="https://unpkg.com/ol-popup@4.0.0"></script> <script src="https://unpkg.com/@esri/arcgis-rest-auth@3.0.0/dist/umd/auth.umd.js"></script> <link rel="stylesheet" href="https://unpkg.com/ol-popup@4.0.0/src/ol-popup.css" /> <script src="https://unpkg.com/@esri/arcgis-rest-demographics@3.0.0/dist/umd/demographics.umd.js"></script> </head> <body> <div id="map"></div> <script> const apiKey = "YOUR-API-KEY"; const map = new ol.Map({ target: "map" }); map.setView( new ol.View({ center: ol.proj.fromLonLat([18.88, 47.33]), zoom: 5 }) ); const basemapId = "ArcGIS:Navigation"; const basemapURL = "https://basemaps-api.arcgis.com/arcgis/rest/services/styles/" + basemapId + "?type=style&apiKey=" + apiKey; olms(map, basemapURL).then(function (map) { const popup = new Popup(); map.addOverlay(popup); map.on('click', (event) => { const lonLat = ol.proj.toLonLat(event.coordinate); const authentication = new arcgisRest.ApiKey({ key: apiKey }); arcgisRest.queryDemographicData({ studyAreas: [{ "geometry": { "x": lonLat[0], "y": lonLat[1] } }], authentication: authentication }) .then((response) => { const data = document.getElementById("data"); const featureSet = response.results[0].value.FeatureSet; let message; if (featureSet.length > 0 && featureSet[0].features.length > 0) { const attributes = featureSet[0].features[0].attributes; message = `<b>Data for a 1 mile search radius</b>` + [ `<br>Population: ${attributes.TOTPOP}`, `Males: ${attributes.TOTMALES} `, `Females: ${attributes.TOTFEMALES}`, `Average Household Size: ${attributes.AVGHHSZ}` ].join('<br>') } else { message = "Data not available for this location."; } popup.show(event.coordinate, message); }); }); }); </script> </body> </html>
Display the results
If the query is successful, the response will contain a results
array with a value containing a FeatureSet
. The FeatureSet contains attributes such as population within the study area, the number of males and females, and the average household size. See the ArcGIS REST API documentation for more details.
You will display the results of the query in a pop-up.
Before the click handler, create a
Popup
and save it to apopup
variable. Add it to the map withmap.addOverlay
.Add line. Add line. <!DOCTYPE html> <html> <head> <meta charset="utf-8"> <meta name="viewport" content="initial-scale=1, maximum-scale=1, user-scalable=no" /> <title>OpenLayers Tutorials: Get Demographic Data</title> <style> html, body, #map { padding: 0; margin: 0; height: 100%; width: 100%; font-family: Arial, Helvetica, sans-serif; font-size: 14px; color: #323232; } #map canvas { cursor: crosshair; } </style> <link rel="stylesheet" href="https://cdn.jsdelivr.net/gh/openlayers/openlayers.github.io@master/en/v6.4.3/css/ol.css" type="text/css" /> <script src="https://cdn.jsdelivr.net/gh/openlayers/openlayers.github.io@master/en/v6.4.3/build/ol.js"></script> <script src="https://cdn.jsdelivr.net/npm/ol-mapbox-style@6.1.4/dist/olms.js" type="text/javascript"></script> <script src="https://unpkg.com/@esri/arcgis-rest-request@3.0.0/dist/umd/request.umd.js"></script> <script src="https://unpkg.com/ol-popup@4.0.0"></script> <script src="https://unpkg.com/@esri/arcgis-rest-auth@3.0.0/dist/umd/auth.umd.js"></script> <link rel="stylesheet" href="https://unpkg.com/ol-popup@4.0.0/src/ol-popup.css" /> <script src="https://unpkg.com/@esri/arcgis-rest-demographics@3.0.0/dist/umd/demographics.umd.js"></script> </head> <body> <div id="map"></div> <script> const apiKey = "YOUR-API-KEY"; const map = new ol.Map({ target: "map" }); map.setView( new ol.View({ center: ol.proj.fromLonLat([18.88, 47.33]), zoom: 5 }) ); const basemapId = "ArcGIS:Navigation"; const basemapURL = "https://basemaps-api.arcgis.com/arcgis/rest/services/styles/" + basemapId + "?type=style&apiKey=" + apiKey; olms(map, basemapURL).then(function (map) { const popup = new Popup(); map.addOverlay(popup); map.on('click', (event) => { const lonLat = ol.proj.toLonLat(event.coordinate); const authentication = new arcgisRest.ApiKey({ key: apiKey }); arcgisRest.queryDemographicData({ studyAreas: [{ "geometry": { "x": lonLat[0], "y": lonLat[1] } }], authentication: authentication }) .then((response) => { const data = document.getElementById("data"); const featureSet = response.results[0].value.FeatureSet; let message; if (featureSet.length > 0 && featureSet[0].features.length > 0) { const attributes = featureSet[0].features[0].attributes; message = `<b>Data for a 1 mile search radius</b>` + [ `<br>Population: ${attributes.TOTPOP}`, `Males: ${attributes.TOTMALES} `, `Females: ${attributes.TOTFEMALES}`, `Average Household Size: ${attributes.AVGHHSZ}` ].join('<br>') } else { message = "Data not available for this location."; } popup.show(event.coordinate, message); }); }); }); </script> </body> </html>
Add a
then
handler to thequeryDemographicData
call. Inside, store theFeatureSet
from the first result in a variable.Add line. Add line. Add line. Add line. Add line. Add line. <!DOCTYPE html> <html> <head> <meta charset="utf-8"> <meta name="viewport" content="initial-scale=1, maximum-scale=1, user-scalable=no" /> <title>OpenLayers Tutorials: Get Demographic Data</title> <style> html, body, #map { padding: 0; margin: 0; height: 100%; width: 100%; font-family: Arial, Helvetica, sans-serif; font-size: 14px; color: #323232; } #map canvas { cursor: crosshair; } </style> <link rel="stylesheet" href="https://cdn.jsdelivr.net/gh/openlayers/openlayers.github.io@master/en/v6.4.3/css/ol.css" type="text/css" /> <script src="https://cdn.jsdelivr.net/gh/openlayers/openlayers.github.io@master/en/v6.4.3/build/ol.js"></script> <script src="https://cdn.jsdelivr.net/npm/ol-mapbox-style@6.1.4/dist/olms.js" type="text/javascript"></script> <script src="https://unpkg.com/@esri/arcgis-rest-request@3.0.0/dist/umd/request.umd.js"></script> <script src="https://unpkg.com/ol-popup@4.0.0"></script> <script src="https://unpkg.com/@esri/arcgis-rest-auth@3.0.0/dist/umd/auth.umd.js"></script> <link rel="stylesheet" href="https://unpkg.com/ol-popup@4.0.0/src/ol-popup.css" /> <script src="https://unpkg.com/@esri/arcgis-rest-demographics@3.0.0/dist/umd/demographics.umd.js"></script> </head> <body> <div id="map"></div> <script> const apiKey = "YOUR-API-KEY"; const map = new ol.Map({ target: "map" }); map.setView( new ol.View({ center: ol.proj.fromLonLat([18.88, 47.33]), zoom: 5 }) ); const basemapId = "ArcGIS:Navigation"; const basemapURL = "https://basemaps-api.arcgis.com/arcgis/rest/services/styles/" + basemapId + "?type=style&apiKey=" + apiKey; olms(map, basemapURL).then(function (map) { const popup = new Popup(); map.addOverlay(popup); map.on('click', (event) => { const lonLat = ol.proj.toLonLat(event.coordinate); const authentication = new arcgisRest.ApiKey({ key: apiKey }); arcgisRest.queryDemographicData({ studyAreas: [{ "geometry": { "x": lonLat[0], "y": lonLat[1] } }], authentication: authentication }) .then((response) => { const data = document.getElementById("data"); const featureSet = response.results[0].value.FeatureSet; let message; if (featureSet.length > 0 && featureSet[0].features.length > 0) { const attributes = featureSet[0].features[0].attributes; message = `<b>Data for a 1 mile search radius</b>` + [ `<br>Population: ${attributes.TOTPOP}`, `Males: ${attributes.TOTMALES} `, `Females: ${attributes.TOTFEMALES}`, `Average Household Size: ${attributes.AVGHHSZ}` ].join('<br>') } else { message = "Data not available for this location."; } popup.show(event.coordinate, message); }); }); }); </script> </body> </html>
If the
FeatureSet
contains data, use its attributes to build a message to show. Usepopup.show
to display the message at the location of the mouse click. Otherwise, display a "Data not available" message.Add line. Add line. Add line. Add line. Add line. Add line. Add line. Add line. Add line. Add line. Add line. Add line. Add line. Add line. <!DOCTYPE html> <html> <head> <meta charset="utf-8"> <meta name="viewport" content="initial-scale=1, maximum-scale=1, user-scalable=no" /> <title>OpenLayers Tutorials: Get Demographic Data</title> <style> html, body, #map { padding: 0; margin: 0; height: 100%; width: 100%; font-family: Arial, Helvetica, sans-serif; font-size: 14px; color: #323232; } #map canvas { cursor: crosshair; } </style> <link rel="stylesheet" href="https://cdn.jsdelivr.net/gh/openlayers/openlayers.github.io@master/en/v6.4.3/css/ol.css" type="text/css" /> <script src="https://cdn.jsdelivr.net/gh/openlayers/openlayers.github.io@master/en/v6.4.3/build/ol.js"></script> <script src="https://cdn.jsdelivr.net/npm/ol-mapbox-style@6.1.4/dist/olms.js" type="text/javascript"></script> <script src="https://unpkg.com/@esri/arcgis-rest-request@3.0.0/dist/umd/request.umd.js"></script> <script src="https://unpkg.com/ol-popup@4.0.0"></script> <script src="https://unpkg.com/@esri/arcgis-rest-auth@3.0.0/dist/umd/auth.umd.js"></script> <link rel="stylesheet" href="https://unpkg.com/ol-popup@4.0.0/src/ol-popup.css" /> <script src="https://unpkg.com/@esri/arcgis-rest-demographics@3.0.0/dist/umd/demographics.umd.js"></script> </head> <body> <div id="map"></div> <script> const apiKey = "YOUR-API-KEY"; const map = new ol.Map({ target: "map" }); map.setView( new ol.View({ center: ol.proj.fromLonLat([18.88, 47.33]), zoom: 5 }) ); const basemapId = "ArcGIS:Navigation"; const basemapURL = "https://basemaps-api.arcgis.com/arcgis/rest/services/styles/" + basemapId + "?type=style&apiKey=" + apiKey; olms(map, basemapURL).then(function (map) { const popup = new Popup(); map.addOverlay(popup); map.on('click', (event) => { const lonLat = ol.proj.toLonLat(event.coordinate); const authentication = new arcgisRest.ApiKey({ key: apiKey }); arcgisRest.queryDemographicData({ studyAreas: [{ "geometry": { "x": lonLat[0], "y": lonLat[1] } }], authentication: authentication }) .then((response) => { const data = document.getElementById("data"); const featureSet = response.results[0].value.FeatureSet; let message; if (featureSet.length > 0 && featureSet[0].features.length > 0) { const attributes = featureSet[0].features[0].attributes; message = `<b>Data for a 1 mile search radius</b>` + [ `<br>Population: ${attributes.TOTPOP}`, `Males: ${attributes.TOTMALES} `, `Females: ${attributes.TOTFEMALES}`, `Average Household Size: ${attributes.AVGHHSZ}` ].join('<br>') } else { message = "Data not available for this location."; } popup.show(event.coordinate, message); }); }); }); </script> </body> </html>
Run the app
In CodePen, run your code to display the map.
You should now see a map centered over eastern Europe. Click on the map to query for demographic data and view the results in a pop-up.
What's next?
Learn how to use additional ArcGIS location services in these tutorials: