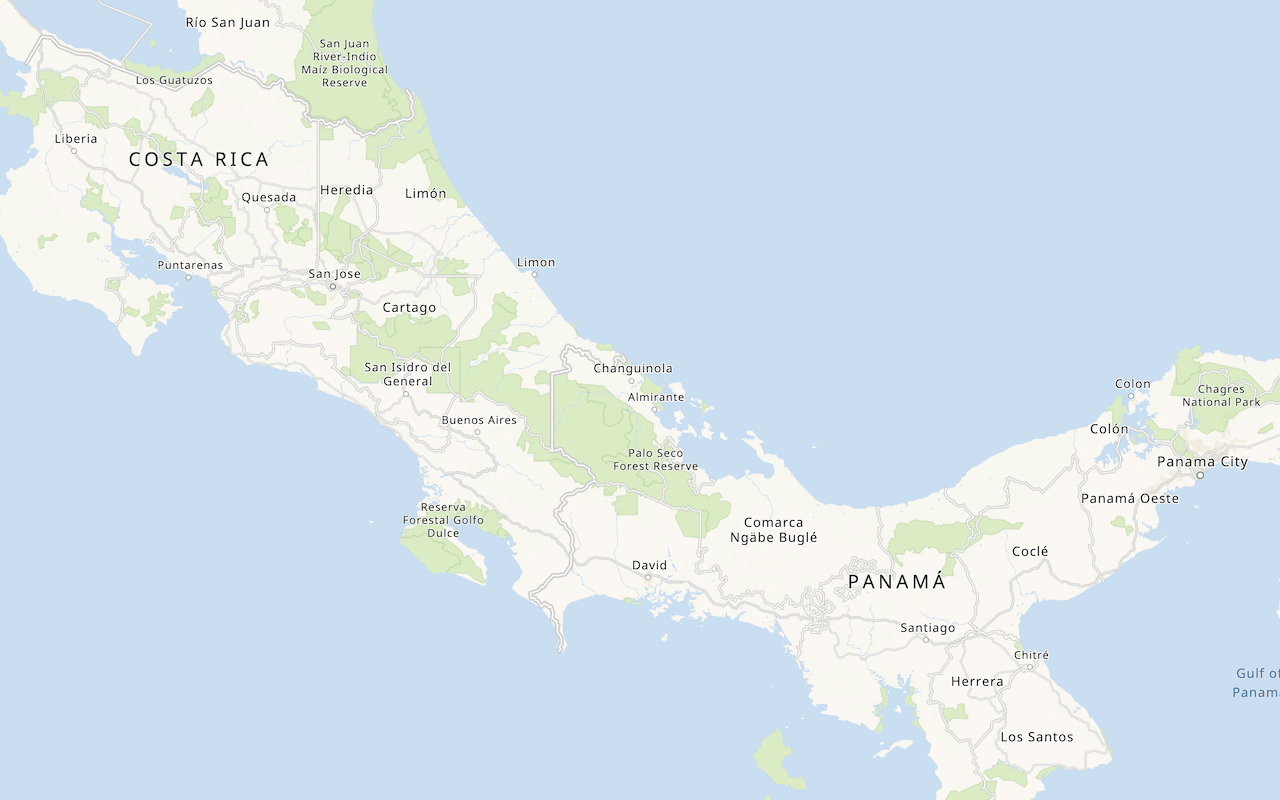
You can style basemap layers, which are composed of vector tile data, and feature layers, which are composed of features, to help visualize the data in your application.
Basemap styles
A basemap style is a set of visual properties such as fill colors, viewing levels, and fonts that define how the visual elements in a vector tile basemap layer are displayed. There are two types of basemap styles: default and custom.
- Default styles: Styles provided by Esri such as
ArcGIS,:Streets ArcGIS, and:Topographic ArcGIS.:Nova - Custom styles: Styles you create and save as items using the ArcGIS Vector Tile Style Editor.
How to display a custom basemap style
- Create a style with the ArcGIS Vector Tile Style Editor.
- Go to the new basemap layer's item page and copy its item ID.
- Reference the OpenLayers CSS, JS, and
ol-mapbox-stylelibraries. - Set the item ID as the basemap style enumeration.
- Set the style URL.
- Load and apply the basemap style to a map using
olms.
Example
Display a custom basemap layer
This example illustrates how you can set the item ID of a custom vector basemap layer in place of a default basemap layer style.
<link rel="stylesheet" href="https://cdn.jsdelivr.net/npm/ol@v10.4.0/ol.css" type="text/css" />
<script src="https://cdn.jsdelivr.net/npm/ol@v10.4.0/dist/ol.js"></script>
<script src="https://cdn.jsdelivr.net/npm/ol-mapbox-style@12.3.5/dist/olms.js"></script>
<script>
/* Use for API key authentication */
const accessToken = "YOUR_ACCESS_TOKEN";
// or
/* Use for user authentication */
// const session = await arcgisRest.ArcGISIdentityManager.beginOAuth2({
// clientId: "YOUR_CLIENT_ID", // Your client ID from OAuth credentials
// redirectUri: "YOUR_REDIRECT_URI", // The redirect URL registered in your OAuth credentials
// portal: "YOUR_PORTAL_URL" // Your portal URL
// })
// const accessToken = session.token;
const basemapId = "6976148c11bd497d8624206f9ee03e30"; // Custom vector tile style
const basemapURL = `https://basemapstyles-api.arcgis.com/arcgis/rest/services/styles/v2/styles/items/${basemapId}?token=${accessToken}`;
olms.apply(map, basemapURL).then(() => {
// Add Esri attribution
// Learn more in https://esriurl.com/attribution
const source = map.getLayers().item(0).getSource();
source.setAttributions(["Powered by <a href='https://www.esri.com/en-us/home' target='_blank'>Esri</a> | ", source.getAttributions()]);
});
</script>
Feature styles
You can style points, lines, and polygons for visualization in a map by defining symbols for features. To style features in a feature layer, you define symbols and apply them with a renderer. For data-driven visualization, the symbol is always determined based on a data (attribute) value returned from a field in the data layer.
To style features in OpenLayers, you use the Style class. A Style object allows you to define symbols using properties such as fill, stroke, text, and image. Once you create a style definition, reference it in your Vector layer to apply it to the features in the feature layer.
How to style a feature layer
- Import your data from a CSV, XLS, GeoJSON, or Shapefile file to create a hosted feature layer.
- Get the URL for the feature layer.
- Reference the OpenLayers CSS, JS, and
ol-mapbox-stylelibraries. - Instantiate a
Styleclass and define symbols for the features you want to visualize. - Reference the
Styleobject and feature layer URL in aVectorlayer.
Example
Style a feature layer (points)
This example customizes a map of trailhead locations so that they display as hiker symbols.
<link rel="stylesheet" href="https://cdn.jsdelivr.net/npm/ol@v10.4.0/ol.css" type="text/css" />
<script src="https://cdn.jsdelivr.net/npm/ol@v10.4.0/dist/ol.js"></script>
<script src="https://cdn.jsdelivr.net/npm/ol-mapbox-style@12.3.5/dist/olms.js" type="text/javascript"></script>
<script>
olms.apply(map, basemapURL).then(function (map) {
const trailheadStyle = function (feature) {
return new ol.style.Style({
image: new ol.style.Icon({
src: "http://static.arcgis.com/images/Symbols/NPS/npsPictograph_0231b.png",
scale: 0.25
}),
});
};
const trailheadsLayer = new ol.layer.Vector({
source: new ol.source.Vector({
format: new ol.format.GeoJSON(),
url: trailheadsLayerURL,
// Attribution text retrieved from https://arcgis.com/home/item.html?id=883cedb8c9fe4524b64d47666ed234a7
attributions: ['Los Angeles GeoHub |']
}),
style: trailheadStyle,
declutter: true
});
map.addLayer(trailheadsLayer);
// Add Esri attribution
// Learn more in https://esriurl.com/attribution
const source = map.getLayers().item(0).getSource();
source.setAttributions("Powered by <a href='https://www.esri.com/en-us/home' target='_blank'>Esri</a> | ")
});
</script>


