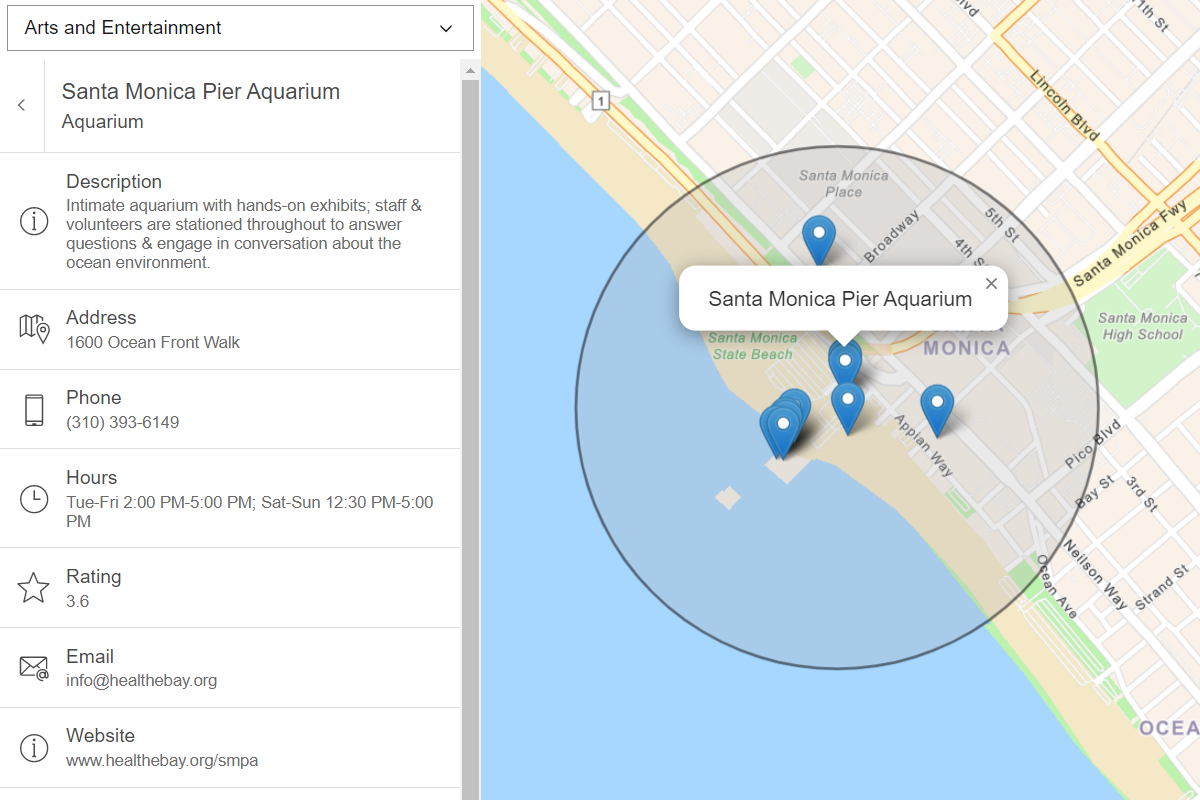
Learn how to perform a text-based search to find places within a bounding box.
A bounding box search finds places within an extent using the places service. An extent typically represents the visible area of a map. To perform a bounding box search, you use the places package from ArcGIS REST JS. With the results of the search, you can make another request to the service and return place attributes such as street address and telephone number.
In this tutorial, you use ArcGIS REST JS to perform a bounding box search based on the visible extent on the map and return details about each place. It includes starter code that uses Calcite components to create a basic search interface.
Prerequisites
Steps
Get the starter code
- To get started, . It contains the Calcite Components necessary to create this application, as well as a blank Leaflet map.
Get an access token
You need an access token with the correct privileges to access the resources used in this tutorial.
-
Go to the Create an API key tutorial and create an API key with the following privilege(s):
- Privileges
- Location services > Basemaps
- Location services > Places
- Privileges
-
Copy the API key access token to your clipboard when prompted.
-
In CodePen, update the
accessvariable to use your access token.Token Use dark colors for code blocks const accessToken = "YOUR_ACCESS_TOKEN"; const basemapId = "arcgis/streets"; const basemapURL = `https://basemapstyles-api.arcgis.com/arcgis/rest/services/styles/v2/styles/${basemapId}?token=${accessToken}`; olms.apply(map, basemapURL);
To learn about the other types of authentication available, go to Types of authentication.
Reference ArcGIS REST JS
-
Reference the
routingandrequestpackages from ArcGIS REST JS.Use dark colors for code blocks <!-- Load OpenLayers from CDN --> <link rel="stylesheet" href="https://cdn.jsdelivr.net/npm/ol@v8.2.0/ol.css" type="text/css" /> <script src="https://cdn.jsdelivr.net/npm/ol@v8.2.0/dist/ol.js"></script> <script src="https://cdn.jsdelivr.net/npm/ol-mapbox-style@10.6.0/dist/olms.js"></script> <script src="https://unpkg.com/ol-popup@5.1.0/dist/ol-popup.js"></script> <link rel="stylesheet" href="https://unpkg.com/ol-popup@5.1.0/src/ol-popup.css"/> <!-- Calcite components --> <script type="module" src=https://js.arcgis.com/calcite-components/1.4.3/calcite.esm.js></script> <link rel="stylesheet" type="text/css" href=https://js.arcgis.com/calcite-components/1.4.3/calcite.css /> <!-- ArcGIS REST JS: request and places --> <script src="https://unpkg.com/@esri/arcgis-rest-request@4.0.0/dist/bundled/request.umd.js"></script> <script src="https://unpkg.com/@esri/arcgis-rest-places@1.0.0/dist/bundled/places.umd.js"></script> -
Create a REST JS
Apiusing your access token.K e y Manager Use dark colors for code blocks const accessToken = "YOUR_ACCESS_TOKEN"; const basemapEnum = "arcgis/community"; const map = new ol.Map({ target: "map", controls: ol.control.defaults.defaults({ zoom:false }) }); map.setView( new ol.View({ center: ol.proj.fromLonLat([-122.32116, 47.62737]), zoom: 13 }) ) olms.apply(map, `https://basemapstyles-api.arcgis.com/arcgis/rest/services/styles/v2/styles/${basemapEnum}?token=${accessToken}`) const authentication = arcgisRest.ApiKeyManager.fromKey(accessToken);
Add event listeners
The provided for this tutorial includes a basic user interface with a text input and category buttons. Add event listeners to this interface to make requests to the places service on when they are clicked.
-
Create a
showfunction to make requests to the places service.Places Use dark colors for code blocks olms.apply(map, `https://basemapstyles-api.arcgis.com/arcgis/rest/services/styles/v2/styles/${basemapEnum}?token=${accessToken}`) const authentication = arcgisRest.ApiKeyManager.fromKey(accessToken); function showPlaces(query) { }; -
Add an event listener to the search button that calls
showon click.Places Use dark colors for code blocks const control = document.getElementById("place-control"); const input = document.getElementById("search-input"); let placesLayer; const placeKeywords = ["Restaurants", "Hotels", "Museums", "ATMs", "Breweries"]; document.getElementById("search-button").addEventListener("click", e => { showPlaces(input.value) }) placeKeywords.forEach(category => { const categoryButton = document.createElement("calcite-button"); categoryButton.setAttribute("class","category-button"); categoryButton.setAttribute("round",true); categoryButton.setAttribute("scale","s"); categoryButton.setAttribute("kind","inverse") categoryButton.innerHTML = category; categoryButton.id = category; control.appendChild(categoryButton); }) -
Add an event listener to each category button that calls
showon click.Places Use dark colors for code blocks placeKeywords.forEach(category => { const categoryButton = document.createElement("calcite-button"); categoryButton.setAttribute("class","category-button"); categoryButton.setAttribute("round",true); categoryButton.setAttribute("scale","s"); categoryButton.setAttribute("kind","inverse") categoryButton.innerHTML = category; categoryButton.id = category; control.appendChild(categoryButton); categoryButton.addEventListener("click", e => { input.value = category; showPlaces(category) }) })
Find places in the map bounds
-
Calculate the current visible extent of the OpenLayers map with
calculate. Transform the extent into WGS84 coordinates (Extent EPSG:4326) for use with the places API.Use dark colors for code blocks function showPlaces(query) { const extent = map.getView().calculateExtent(); const bounds = ol.proj.transformExtent(extent,'EPSG:3857','EPSG:4326') }; -
Use the ArcGIS REST JS
findfunction to make a request to the places service. Set thePlaces Within Extent searchparameter to your query and pass the current map bounding box to theText xmin,xmax,ymin, andymaxparameters.Use dark colors for code blocks function showPlaces(query) { const extent = map.getView().calculateExtent(); const bounds = ol.proj.transformExtent(extent,'EPSG:3857','EPSG:4326') arcgisRest.findPlacesWithinExtent({ xmin: bounds[0], ymin: bounds[1], xmax: bounds[2], ymax: bounds[3], searchText: query, authentication, f:"geojson" }) };
Display results
The response from the places service will contain a list of place results. Each result will include a place's x/y coordinates, name, category, and unique ID.
-
Create an empty
Vectorlayer to store service results. When a new request is made, clear the data in the layer.Use dark colors for code blocks olms.apply(map, `https://basemapstyles-api.arcgis.com/arcgis/rest/services/styles/v2/styles/${basemapEnum}?token=${accessToken}`) .then(map => { placesLayer = new ol.layer.Vector({ source: new ol.source.Vector(), }); map.addLayer(placesLayer); }) const authentication = arcgisRest.ApiKeyManager.fromKey(accessToken); const popup = new Popup(); map.addOverlay(popup) function showPlaces(query) { placesLayer.getSource().clear(); const extent = map.getView().calculateExtent(); const bounds = ol.proj.transformExtent(extent,'EPSG:3857','EPSG:4326') arcgisRest.findPlacesWithinExtent({ xmin: bounds[0], ymin: bounds[1], xmax: bounds[2], ymax: bounds[3], searchText: query, authentication, f:"geojson" }) }; -
Style the vector layer with an
Iconthat will display for each place result. Set thesrcproperty to this custom icon.Use dark colors for code blocks .then(map => { placesLayer = new ol.layer.Vector({ source: new ol.source.Vector(), style: new ol.style.Style({ image: new ol.style.Icon({ anchor: [0.5, 0.99], anchorXUnits: 'fraction', anchorYUnits: 'fraction', scale:0.3, src: 'data:image/png;base64,iVBORw0KGgoAAAANSUhEUgAAAHgAAAB5CAYAAADyOOV3AAAAAXNSR0IArs4c6QAAAARnQU1BAACxjwv8YQUAAAAZdEVYdFNvZnR3YXJlAEFkb2JlIEltYWdlUmVhZHlxyWU8AAADKGlUWHRYTUw6Y29tLmFkb2JlLnhtcAAAAAAAPD94cGFja2V0IGJlZ2luPSLvu78iIGlkPSJXNU0wTXBDZWhpSHpyZVN6TlRjemtjOWQiPz4gPHg6eG1wbWV0YSB4bWxuczp4PSJhZG9iZTpuczptZXRhLyIgeDp4bXB0az0iQWRvYmUgWE1QIENvcmUgNS42LWMwMTQgNzkuMTU2Nzk3LCAyMDE0LzA4LzIwLTA5OjUzOjAyICAgICAgICAiPiA8cmRmOlJERiB4bWxuczpyZGY9Imh0dHA6Ly93d3cudzMub3JnLzE5OTkvMDIvMjItcmRmLXN5bnRheC1ucyMiPiA8cmRmOkRlc2NyaXB0aW9uIHJkZjphYm91dD0iIiB4bWxuczp4bXA9Imh0dHA6Ly9ucy5hZG9iZS5jb20veGFwLzEuMC8iIHhtbG5zOnhtcE1NPSJodHRwOi8vbnMuYWRvYmUuY29tL3hhcC8xLjAvbW0vIiB4bWxuczpzdFJlZj0iaHR0cDovL25zLmFkb2JlLmNvbS94YXAvMS4wL3NUeXBlL1Jlc291cmNlUmVmIyIgeG1wOkNyZWF0b3JUb29sPSJBZG9iZSBQaG90b3Nob3AgQ0MgMjAxNCAoTWFjaW50b3NoKSIgeG1wTU06SW5zdGFuY2VJRD0ieG1wLmlpZDozQjg2NjYzRjZDNDkxMUU0QTM3RThDNzNCRDk3QTcyQSIgeG1wTU06RG9jdW1lbnRJRD0ieG1wLmRpZDozQjg2NjY0MDZDNDkxMUU0QTM3RThDNzNCRDk3QTcyQSI+IDx4bXBNTTpEZXJpdmVkRnJvbSBzdFJlZjppbnN0YW5jZUlEPSJ4bXAuaWlkOjNCODY2NjNENkM0OTExRTRBMzdFOEM3M0JEOTdBNzJBIiBzdFJlZjpkb2N1bWVudElEPSJ4bXAuZGlkOjNCODY2NjNFNkM0OTExRTRBMzdFOEM3M0JEOTdBNzJBIi8+IDwvcmRmOkRlc2NyaXB0aW9uPiA8L3JkZjpSREY+IDwveDp4bXBtZXRhPiA8P3hwYWNrZXQgZW5kPSJyIj8+51b2xQAABXZJREFUeF7t3YttG1cQhWGX4BJSQkpICSnBpaSDlOASUoJLSAkpISUoO4RoMEc/xb374M97cQf4YOBI4nJmQC65evjL29vbNDAMp3FgOI0Dw2kcGE7jwHAaB4bTODCcxoHhNA4Mp3FgOI0Dw2kcGE7jwNCys74uflv8sfhr8WPx76Ju+JH6vPr8+rr6+rqdur3NRf0ZMLRsqF8Xfy7+Xtwu7Ch1u3X7dZymov4MGFoa6tvirKXeU8er464q6s+AoWVF1YD/WdwO/tnq+A8XTf0ZMLR8Ur8s6hx5O2hb3Z+6X1jUnwFDy52q89/aF0vPVvcLz8/UnwFDC1Q9Fd4O9FV9eMqm/gwYWqJe+ZGbPjySqT8DhpabqvegvSz3qu7vz/fO1J8BQ8tNfV/cDq8Xdb8vRf0ZMLS8V70yvR1aby6vrKk/A4aW9+r10Xt1eRRTfwYMLUvVOex2WEep82O9b63LjnWtuf5tuVbd6iv1Z8DQstTRb4vq0fToOnJ9/OhnjW/UnwFDy1JHDbq+K3T3KtOdqs+vr6Pba/Wd+jNgaFnqiMuRD68TP6gjnkV+UH8GDC0xpC32Lvdau5ecvVkwtOSQGh213GvtWnL2ZsHQkkNqUOfOM2rzOTl7s2BoySE1aH1BtbY2X3TJ3iwYWnJIK10uLJxYm17ZZ28WDC05pJUevc/dW3X7dNxPZW8WDC05pBXqStQzqvmKV/ZmwdCSQ1qh3jc/o5rfn2dvFgwtOaQVzj7/Xqv5PJy9WTC05JBWqG8cPKPqOHT8u7I3C4aWHNIKZ73/zWp+P5y9WTC05JBWmOfgBzC05JBWekbRcT+VvVkwtOSQVvp9cWbV7dNxP5W9WTC05JBWOvs8vOl6dPZmwdCSQ2pw1tWsTVexSvZmwdCSQ2pw1out5hdXV9mbBUNLDqlR/SDdkVW3R8dZJXuzYGjJIW0wf6IjYGjJIW2095G865F7lb1ZMLTkkHao38avv7PRUvX5h/3VgOzNgqElh3SAepFUT7f3fuKj8vr45hdT92RvFgwtOaSDXX+74eqs32q4yN4sGFpySD3L3iwYWnJIPcveLBhackg9y94sGFpySD3L3iwYWnJIPcveLBhackg9y94sGFpySD3L3iwYWnJIPcveLBhackg9y94sGFpySD3L3iwYWnJIPcveLBhackg9y94sGFpySD3L3iwYWnJIPcveLBhackg9y94sGFpySD3L3iwYWnJIPcveLBhackg9y94sGFpySD3L3iwYWnJIPcveLBhackg9y94sGFpySD3L3iwYWnJIPcveLBhackg9y94sGFpySD3L3iwYWnJIPcveLBhackg9y94sGFpySD3L3iwYWnJIPcveLBhackg9y94sGFpySD3L3iwYWnJIPcveLBhaltr9x09exPyfz8h79b7kuv/YnwFDy031uuTLcquoPwOGlqjelvxzuVXUnwFDC1QvS/7fcquoPwOGljv16kv+sNwq6s+AoeWTetUl43KrqD8DhpYH9WpLvrvcKurPgKFlRb3Kkj9dbhX1Z8DQsrLsJT9cbhX1Z8DQ0lDWklctt4r6M2BoaaxnL3n1cquoPwOGlg31rCU3LbeK+jNgaNlYZy+5eblV1J8BQ8uOOmvJm5ZbRf0ZMLTsrKOXvHm5VdSfAUPLAXXUknctt4r6M2BoOaj2Lnn3cquoPwOGlgNr65IPWW4V9WfA0HJwtS75sOVWUX8GDC0n1NolH7rcKurPgKHlpHq05MOXW0X9GTC0nFj3lnzKcquoPwOGlpMrl3zacquoPwOGlifUdcmnLreK+jNgOI0Dw2kcGE7jwHAaB4bTODCcxoHhNA4Mp3FgOI0Dw2kcGE7jwHAaxduX/wD39UwPVEJ3/AAAAABJRU5ErkJggg==' }) }) }); map.addLayer(placesLayer); }) -
Access the service results. For each result, create a new
Featurecontaining aname, anid, and aPointlocation in Web Mercator coordinates (EPSG:3857). Store the features in a list.Use dark colors for code blocks function showPlaces(query) { placesLayer.getSource().clear(); const extent = map.getView().calculateExtent(); const bounds = ol.proj.transformExtent(extent,'EPSG:3857','EPSG:4326') arcgisRest.findPlacesWithinExtent({ xmin: bounds[0], ymin: bounds[1], xmax: bounds[2], ymax: bounds[3], searchText: query, authentication, f:"geojson" }) .then((response)=>{ const places = []; response.results.forEach(result => { const location = ol.proj.transform([result.location.x,result.location.y], "EPSG:4326", "EPSG:3857"); places.push(new ol.Feature({ name: result.name, id: result.placeId, geometry: new ol.geom.Point(location) })) }) }); }; -
Create a new
Vectorsource using the list of place features. Set theplacessource to display the results on your map.Layer Use dark colors for code blocks function showPlaces(query) { placesLayer.getSource().clear(); const extent = map.getView().calculateExtent(); const bounds = ol.proj.transformExtent(extent,'EPSG:3857','EPSG:4326') arcgisRest.findPlacesWithinExtent({ xmin: bounds[0], ymin: bounds[1], xmax: bounds[2], ymax: bounds[3], searchText: query, authentication, f:"geojson" }) .then((response)=>{ const places = []; response.results.forEach(result => { const location = ol.proj.transform([result.location.x,result.location.y], "EPSG:4326", "EPSG:3857"); places.push(new ol.Feature({ name: result.name, id: result.placeId, geometry: new ol.geom.Point(location) })) }) const source = new ol.source.Vector({features: places}); placesLayer.setSource(source) }); }; -
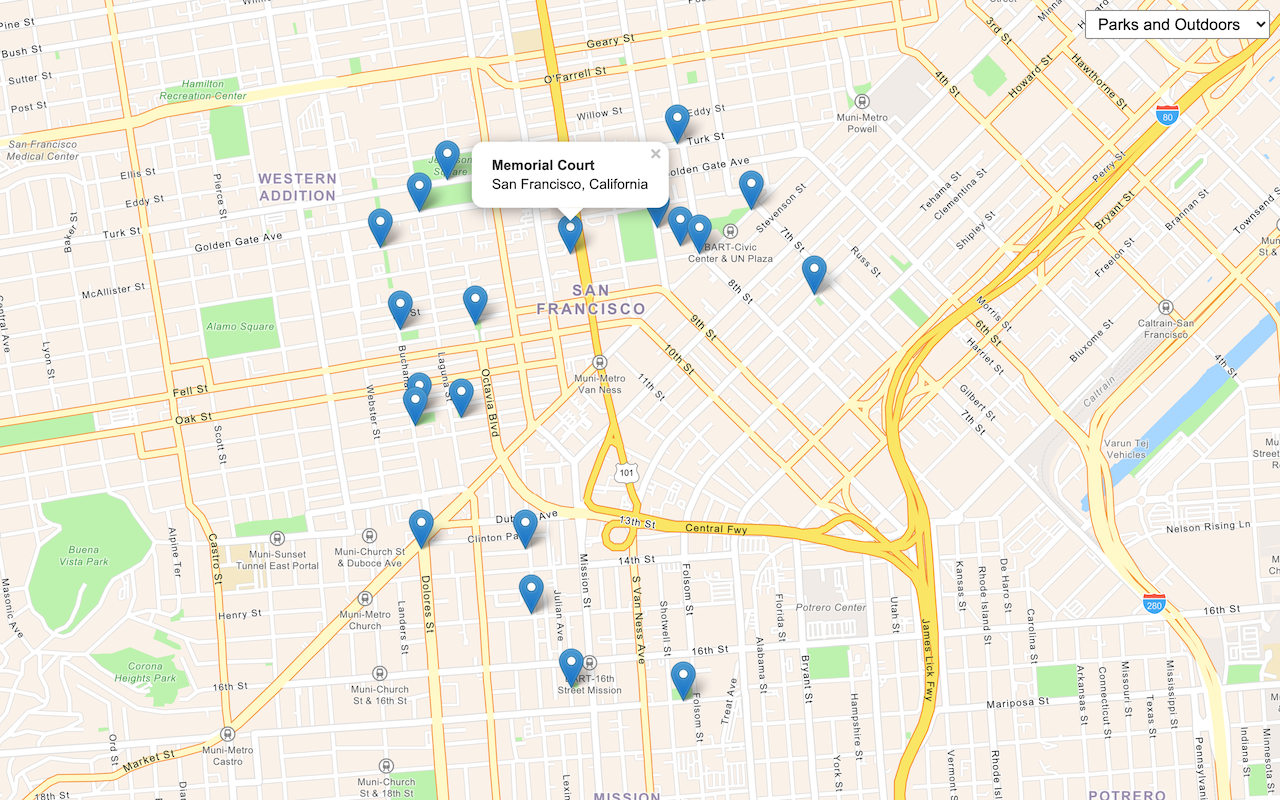
Run the app. When you click a category button or search for a phrase, the map should display a set of points representing place results.
Configure a popup
The user of your app should be able to click on a place result to view more information about that place. Create a popup that will display when the user clicks on a place.
-
Create a
Popupand add it to your map as an overlay. Hide the popup when a new request is made.Use dark colors for code blocks const popup = new Popup(); map.addOverlay(popup) function showPlaces(query) { placesLayer.getSource().clear(); popup.hide() const extent = map.getView().calculateExtent(); const bounds = ol.proj.transformExtent(extent,'EPSG:3857','EPSG:4326') arcgisRest.findPlacesWithinExtent({ xmin: bounds[0], ymin: bounds[1], xmax: bounds[2], ymax: bounds[3], searchText: query, authentication, f:"geojson" }) -
When the map is clicked, use
getto check if the user clicked a point of interest. Hide the popup if no POI were clicked.Features At Pixel Use dark colors for code blocks map.on("click", e => { const clickedPlaces = map.getFeaturesAtPixel(e.pixel, { layerFilter: (layer) => layer === placesLayer}); if (clickedPlaces.length > 0) { } else { popup.hide(); } })
Get place address and phone number
You can access more information about a place using the unique place associated with it. Perform a subsequent request to the places service to get the street address and phone number of a clicked POI.
-
Use the ArcGIS REST JS
getfunction to get detailed information about a specific place. Pass thePlace Details placeassociated with the current marker, and set theI d requestedparameter to return theFields streetandAddress telephoneproperties.Use dark colors for code blocks map.on("click", e => { const clickedPlaces = map.getFeaturesAtPixel(e.pixel, { layerFilter: (layer) => layer === placesLayer}); if (clickedPlaces.length > 0) { arcgisRest.getPlaceDetails(({ placeId: clickedPlaces[0].get("id"), authentication, requestedFields: ["name","address:streetAddress", "contactInfo:telephone"] })) } else { popup.hide(); } }) -
Access the service response. Configure the popup contents to display results if they are available.
Use dark colors for code blocks map.on("click", e => { const clickedPlaces = map.getFeaturesAtPixel(e.pixel, { layerFilter: (layer) => layer === placesLayer}); if (clickedPlaces.length > 0) { arcgisRest.getPlaceDetails(({ placeId: clickedPlaces[0].get("id"), authentication, requestedFields: ["name","address:streetAddress", "contactInfo:telephone"] })) .then((result)=>{ let popupContents = `<b>${result.placeDetails.name}</b><br>`; if (result.placeDetails.address.streetAddress) popupContents += `${result.placeDetails.address.streetAddress}<br>`; if (result.placeDetails.contactInfo.telephone) popupContents += `${result.placeDetails.contactInfo.telephone}`; }); } else { popup.hide(); } }) -
Show the popup at the clicked location with the proper contents.
Use dark colors for code blocks map.on("click", e => { const clickedPlaces = map.getFeaturesAtPixel(e.pixel, { layerFilter: (layer) => layer === placesLayer}); if (clickedPlaces.length > 0) { arcgisRest.getPlaceDetails(({ placeId: clickedPlaces[0].get("id"), authentication, requestedFields: ["name","address:streetAddress", "contactInfo:telephone"] })) .then((result)=>{ let popupContents = `<b>${result.placeDetails.name}</b><br>`; if (result.placeDetails.address.streetAddress) popupContents += `${result.placeDetails.address.streetAddress}<br>`; if (result.placeDetails.contactInfo.telephone) popupContents += `${result.placeDetails.contactInfo.telephone}`; popup.show(e.coordinate, popupContents); }); } else { popup.hide(); } })
Run the app
In CodePen, run your code to display the application. The app should display a map with a search control. Upon clicking a button or entering a phrase, place results should appear on the map. Clicking a result will submit another service request to get the place address and phone number.
What's next?
Learn how to use additional ArcGIS location services in these tutorials:

Find nearby places and details
Find points of interest near a location and get detailed information about them

Find place addresses
Search for coffee shops, gas stations, restaurants and other nearby places with the Geocoding service.

Find a route and directions
Find a route and directions with the route service.