Learn how to add a vector tile layer to a map.
A vector tile layer is a hosted data layer. The data is vector tile data. You can create a vector tile layer by publishing your data with data management tools. To display vector tiles in OpenLayers, you use a Vector source to retrieve the tiles, and a Vector layer to display them.
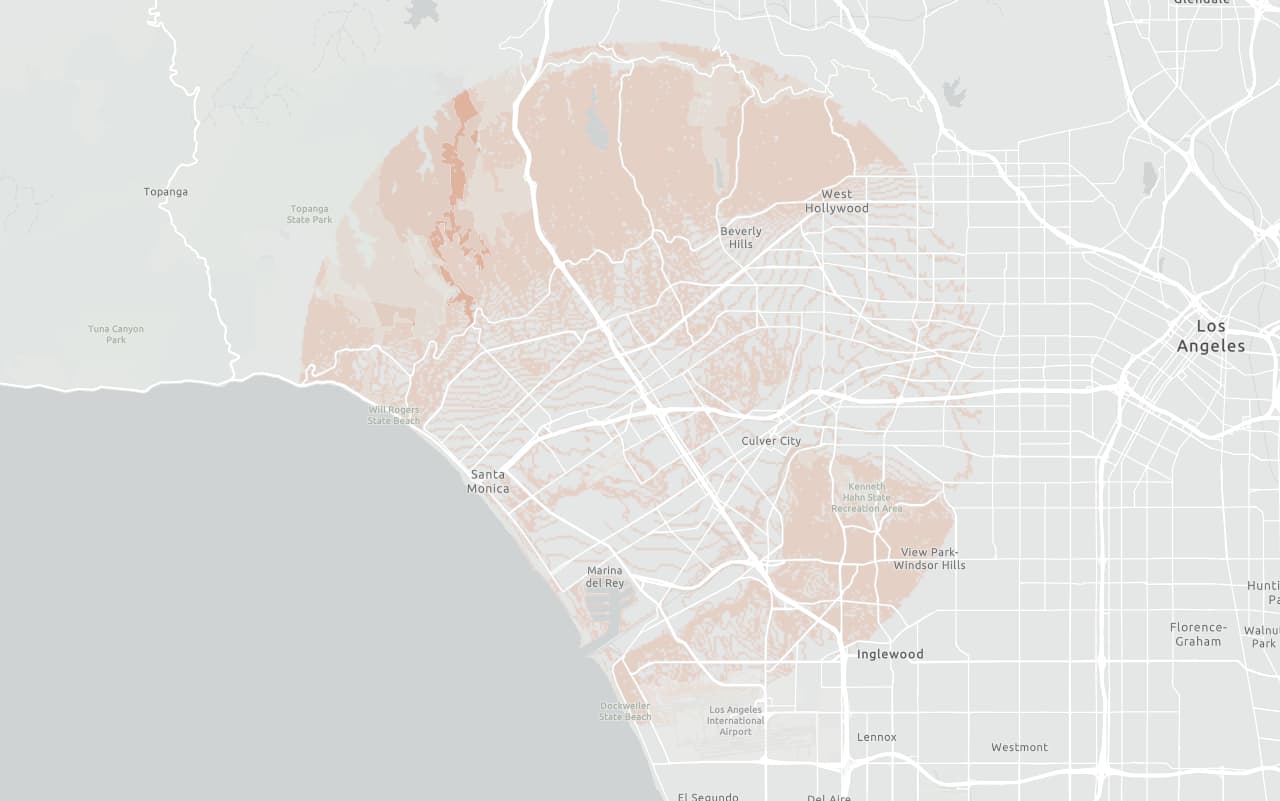
In this tutorial, you display a parcels layer from a public vector tile service, using the default styling.
Prerequisites
You need an ArcGIS Location Platform or ArcGIS Online account.
Steps
Get the starter app
Select a type of authentication and follow the steps to create a new app.
Choose API key authentication if you:
- Want the easiest way to get started.
- Want to build public applications that access ArcGIS Location Services and secure items.
- Have an ArcGIS Location Platform or ArcGIS Online account.
Choose user authentication if you:
- Want to build private applications.
- Require application users to sign in with their own ArcGIS account and access resources their behalf.
- Have an ArcGIS Online account.
To learn more about both types of authentication, go to Authentication.
Set up authentication
Set developer credentials
Use the API key or OAuth developer credentials so your application can access ArcGIS services.
Create the vector tile source
To access the vector tile service, you use a Vector source. You will pass the URL, which contains {x}, {y} and {z} fields. These are substituted with appropriate values as each tile is requested. As the user pans and zooms the viewport, more tiles will be requested automatically.
As the format parameter, you will pass an MVT (Mapbox Vector Tile) feature format, which tells OpenLayers how to decode each vector tile file as it is received.
-
Inside
olmsload handler, create aVectorsource using anTile MVTfeature format. Save it to aparcelsvariable.Source Use dark colors for code blocks olms.apply(map, basemapURL).then((map) => { const parcelsSource = new ol.source.VectorTile({ format: new ol.format.MVT(), url: "https://vectortileservices3.arcgis.com/GVgbJbqm8hXASVYi/arcgis/rest/services/Santa_Monica_Mountains_Parcels_VTL/VectorTileServer/tile/{z}/{y}/{x}.pbf", }); // Add Esri attribution. Learn more in https://esriurl.com/attribution const source = map.getLayers().item(0).getSource(); const poweredByEsriString = "Powered by <a href='https://www.esri.com/en-us/home' target='_blank'>Esri</a> | "; const attributionFn = source.getAttributions(); if (attributionFn) { source.setAttributions((ViewStateLayerStateExtent) => { return [poweredByEsriString, ...attributionFn(ViewStateLayerStateExtent)]; }); } else source.setAttributions(poweredByEsriString); }); -
Add the data attribution for the vector tile layer source.
- Go to the Santa Monica Mountains Parcels item.
- Scroll down to the Acknowledgments section and copy its value.
- Paste the copied value to the
attributionsproperty.Use dark colors for code blocks olms.apply(map, basemapURL).then((map) => { const parcelsSource = new ol.source.VectorTile({ format: new ol.format.MVT(), url: "https://vectortileservices3.arcgis.com/GVgbJbqm8hXASVYi/arcgis/rest/services/Santa_Monica_Mountains_Parcels_VTL/VectorTileServer/tile/{z}/{y}/{x}.pbf", // Attribution text retrieved from https://arcgis.com/home/item.html?id=f0298e881b5b4743bbdf2c7d378acc84 attributions: ["| County of Los Angeles Office of the Assessor"] }); // Add Esri attribution. Learn more in https://esriurl.com/attribution const source = map.getLayers().item(0).getSource(); const poweredByEsriString = "Powered by <a href='https://www.esri.com/en-us/home' target='_blank'>Esri</a> | "; const attributionFn = source.getAttributions(); if (attributionFn) { source.setAttributions((ViewStateLayerStateExtent) => { return [poweredByEsriString, ...attributionFn(ViewStateLayerStateExtent)]; }); } else source.setAttributions(poweredByEsriString); });
Add the vector tile layer
To display the data, you use a Vector layer. This tells OpenLayers how to render the data from the source on the map. Finally, you add the layer to the map using map.add.
-
Create a
Vectorlayer, referencing theTile parcelssource.Source The layer will be rendered with the default styling, as no style information was provided. See the OpenLayers documentation for more details.
Use dark colors for code blocks const parcelsSource = new ol.source.VectorTile({ format: new ol.format.MVT(), url: "https://vectortileservices3.arcgis.com/GVgbJbqm8hXASVYi/arcgis/rest/services/Santa_Monica_Mountains_Parcels_VTL/VectorTileServer/tile/{z}/{y}/{x}.pbf", // Attribution text retrieved from https://arcgis.com/home/item.html?id=f0298e881b5b4743bbdf2c7d378acc84 attributions: ["| County of Los Angeles Office of the Assessor"] }); const parcelsLayer = new ol.layer.VectorTile({ source: parcelsSource }); -
Add the layer to the map with
map.add.Layer Use dark colors for code blocks const parcelsLayer = new ol.layer.VectorTile({ source: parcelsSource }); map.addLayer(parcelsLayer);
Run the app
Run the app.
You should see the vector tile layer with parcels displayed on the basemap layer.What's next?
Learn how to use additional location services in these tutorials: