The Suitability Modeler widget combines and weights different layers so you can evaluate multiple factors at once. Suitability models can help answer questions such as the following:
-
Where are the greatest risks for insect damage?
-
Where are optimal locations for a commercial development?
The answers to these types of questions depend on the input data and the criteria defined from that data.
The Suitability Modeler widget uses fast, web-based weighted raster overlay (WRO) to generate models from a service. Users can start from a blank state of a WRO service or a preconfigured WRO model. Once they have chosen layers, assigned weights, and adjusted layer classification values to define the analysis, they can run the model, visualize results, and optionally save the result as an item in their organization.
The rasters in a WRO are stored in a mosaic dataset. Create a mosaic dataset using the weighted raster overlay service toolbox.
The Suitability Modeler widget uses a special type of image layer known as a weighted overlay service. There are weighted overlay services provided by Esri and available publicly in ArcGIS Online, including ecological and physiographic datasets that have global extents. Once your data is prepared, use the Create Weighted Overlay Mosaic tool from the toolbox to create the mosaic dataset and add supported rasters.
Learn more about creating the weighted overlay mosaic
The resulting dataset contains the properties and populates mosaic fields for the Suitability Modeler widget to use. However, the dataset must be published as a service in ArcGIS Pro to your ArcGIS organization so that the widget can access it. Share the mosaic dataset using the following methods based on your ArcGIS organization and follow the guidance for mosaic options:
-
Share with ArcGIS Image Dedicated
The suitability models created by the Suitability Modeler widget can be exported as hosted image service layers, which are referred to as weighted overlay model services.
Examples
Use this widget to support app design requirements such as the following:
-
You want users to find the best location for an activity.
-
You want users to predict susceptibility to risk.
-
You want users to identify where an event is likely to occur.
Usage notes
This widget requires connecting to a Map widget. You can connect multiple Suitability Modeler widgets to the same Map widget.
When you include this widget in an app, it provides users with the following panels:
-
Select layers—Specify which layers to include in the modeling output by selecting from layers in the configured WRO service.
-
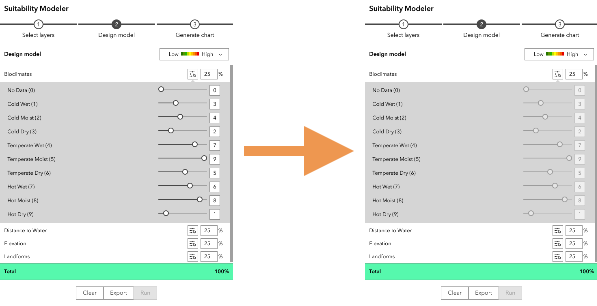
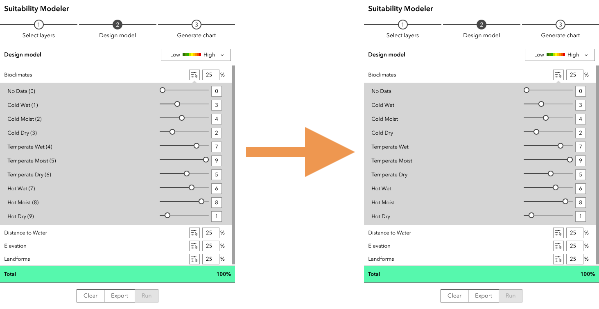
Design model—Assign each selected layer a relative importance in the analysis by specifying the individual weights in the percentage (%) text box. All weights must add up to 100 percent. Assign suitability scores (0 to 9) to the ranges for each of the selected layers. Optionally, change the color ramp for the results. This panel includes the following buttons:
-
Clear—Clear all the parameters in the widget, including the selected layers, scores, weights, results, and charts.
-
Export (optional)—Save the model as a weighted overlay model service that can be added to maps or used as the starting state for a preconfigured model. Currently, for users to see the Export button when they open the app, the user must be signed in with an ArcGIS account that has privileges to create content in their organization.
-
Run—Add the suitability model layer to the connected Map widget based on the selected layers, weights, scores, and colors in the model. Running the model again with changes updates the layer in the map.
-
-
Generate chart—Summarize the output of the model based on data in a drawn polygon or selected polygon feature from a layer in the map. The Pan tool moves the map without changing the polygons. (You can click Clear to clear the drawn or selected polygon.)
Settings
The Suitability Modeler widget includes the following settings:
-
Select a map—Choose the Map widget to display the result of the model.
-
Display label—Use the name of the configured widget as a heading in the widget at run time.
-
Allow export—Include an Export button in the widget for users to save the model as a weighted overlay model service. (Exporting requires an ArcGIS organizational account with privileges to create content.)
-
Lock suitability slider—Check the check box to lock the slider controls that are used to adjust the score of a raster layer's data class scores.
-
Hide numeric ranges from data class labels—Check the check box to hide numerical values or ranges that appear next to data class labels.
-
Starting state—Define the default state for the widget by starting with a preconfigured model or a blank model.
-
Blank model—Reference a WRO service URL directly for users to configure their own layer criteria combinations from a blank state every time they open the widget. Start with a blank model when the layer combinations are open for experimentation.
-
Preconfigured model—Search for a WRO model that is already set up with a WRO service, layer combinations, and weighting (users can still change the layer selection and model settings in the widget). Start with a preconfigured model when users are expected to derive new models from an existing model. For example, a user may want to model various stakeholders’ views on risk factors and their respective importance.
-
Understand weighted overlay
Weighted overlay has three conceptual steps. First, each raster layer is assigned a weight, as a percentage, in the analysis. This allows users to emphasize the relative importance of each layer in the analysis. Second, values within each raster layer are mapped to a common suitability scale, allowing users to compare the different types of information in each raster layer. Third, all raster layers in the analysis are overlaid. Each raster cell’s suitability value is multiplied by its layer weight and totaled with the values of other raster cells it overlays. The result is a suitability value that is used for symbology in the output raster layer.

In the illustration, the two input rasters have been reclassified to a suitability scale of 1 to 3. Each raster is weighted with a percent influence. The cell values are multiplied by their weight, and the results are added together to create the output raster. For example, in the upper left cell, the values for the two inputs become (2 * 0.75) = 1.5 and (3 * 0.25) = 0.75. The sum of 1.5 and 0.75 is 2.25. The final value is rounded to 2 because the output is an integer raster layer.
Weighted overlay models provide a powerful way to visualize and analyze site suitability factors. The results of a model can be used to identify areas of opportunity and risk.