Heat chart visualizes data in a matrix format, where individual values are represented as colors in cells. It is useful for identifying patterns, correlations, and outliers in large datasets.
There are different types of heat charts depending on the data and use case:
- Calendar heat chart: used to visualize data over time with two date fields provided via the
xAxisFieldandyAxisFieldproperties.- Each cell corresponds to the specific calendar unit defined by the intersection of the row and column.
- The temporal binning for each axis needs to be set accordingly via
xTemporalBinningandyTemporalBinningto define the calendar units (e.g., day of month, month of year).
- Matrix heat chart: used to visualize relationships between two categorical fields (
integerorstring) via thexAxisFieldandyAxisFieldproperties.- Each cell represents the intersection of the two categories, and all records sharing the same category values will be aggregated into the same cell.
In this tutorial, you will create and customize a calendar heat chart using heat chart model and render it with the <arcgis-chart> component.
Prerequisites
Steps
Create a new pen
- Go to CodePen to create a new pen for your application.
Add basic HTML
Define a basic HTML page.
- In CodePen > HTML, add HTML to create a basic page.
<html><head><meta charset="utf-8" /><meta name="viewport" content="width=device-width, initial-scale=1, shrink-to-fit=no" /><title>ArcGIS Maps SDK for JavaScript Tutorials: Heat chart</title><style>html,body,arcgis-chart {height: 100%;margin: 0;}</style></head><body></body></html>
Add the ArcGIS Maps SDK for JavaScript script tag
- In the
<head>, add the<script>tag for the JavaScript Maps SDK.9 collapsed lines<html><head><meta charset="utf-8" /><meta name="viewport" content="width=device-width, initial-scale=1, shrink-to-fit=no" /><title>ArcGIS Maps SDK for JavaScript Tutorials: Heat chart</title><style>html,body,arcgis-chart {height: 100%;margin: 0;}</style><!-- Load the ArcGIS Maps SDK for JavaScript from CDN --><script type="module" src="https://js.arcgis.com/5.0/"></script>5 collapsed lines</head></html>
Add chart component
- In the
<body>tag, add the<arcgis-chart>component.23 collapsed lines<html><head><meta charset="utf-8" /><meta name="viewport" content="width=device-width, initial-scale=1, shrink-to-fit=no" /><title>ArcGIS Maps SDK for JavaScript Tutorials: Heat chart</title><style>html,body,arcgis-chart {height: 100%;margin: 0;}</style><!-- Load the ArcGIS Maps SDK for JavaScript from CDN --><script type="module" src="https://js.arcgis.com/5.0/"></script></head><body><arcgis-chart></arcgis-chart></body>3 collapsed lines</html>
Add logic to create a chart
-
Within the
<body>tag, add a<script>tag withtype="module"to write JavaScript code to create a chart with charts model.28 collapsed lines<html><head><meta charset="utf-8" /><meta name="viewport" content="width=device-width, initial-scale=1, shrink-to-fit=no" /><title>ArcGIS Maps SDK for JavaScript Tutorials: Heat chart</title><style>html,body,arcgis-chart {height: 100%;margin: 0;}</style><!-- Load the ArcGIS Maps SDK for JavaScript from CDN --><script type="module" src="https://js.arcgis.com/5.0/"></script></head><body><arcgis-chart></arcgis-chart><script type="module"></script>5 collapsed lines</body></html> -
Within the
<script>tag, use@arcgis.import()to import thecreateModelfunction from@arcgis/charts-componentsandFeatureLayerfrom@arcgis/core/layers/FeatureLayer.js.28 collapsed lines<html><head><meta charset="utf-8" /><meta name="viewport" content="width=device-width, initial-scale=1, shrink-to-fit=no" /><title>ArcGIS Maps SDK for JavaScript Tutorials: Heat chart</title><style>html,body,arcgis-chart {height: 100%;margin: 0;}</style><!-- Load the ArcGIS Maps SDK for JavaScript from CDN --><script type="module" src="https://js.arcgis.com/5.0/"></script></head><body><arcgis-chart></arcgis-chart><script type="module">const { createModel } = await $arcgis.import("@arcgis/charts-components");const FeatureLayer = await $arcgis.import("@arcgis/core/layers/FeatureLayer.js");</script>5 collapsed lines</body></html> -
Load a feature layer from a
portalItemthat contains New York City hotel data that will be visualized in the heat chart.28 collapsed lines<html><head><meta charset="utf-8" /><meta name="viewport" content="width=device-width, initial-scale=1, shrink-to-fit=no" /><title>ArcGIS Maps SDK for JavaScript Tutorials: Heat chart</title><style>html,body,arcgis-chart {height: 100%;margin: 0;}</style><!-- Load the ArcGIS Maps SDK for JavaScript from CDN --><script type="module" src="https://js.arcgis.com/5.0/"></script></head><body><arcgis-chart></arcgis-chart><script type="module">const { createModel } = await $arcgis.import("@arcgis/charts-components");const FeatureLayer = await $arcgis.import("@arcgis/core/layers/FeatureLayer.js");const featureLayer = new FeatureLayer({portalItem: {id: "a8fbe2753beb4cd4aeef4d47e5e32a7c",},});</script>5 collapsed lines</body></html> -
Use
document.querySelector()to select the<arcgis-chart>component.28 collapsed lines<html><head><meta charset="utf-8" /><meta name="viewport" content="width=device-width, initial-scale=1, shrink-to-fit=no" /><title>ArcGIS Maps SDK for JavaScript Tutorials: Heat chart</title><style>html,body,arcgis-chart {height: 100%;margin: 0;}</style><!-- Load the ArcGIS Maps SDK for JavaScript from CDN --><script type="module" src="https://js.arcgis.com/5.0/"></script></head><body><arcgis-chart></arcgis-chart><script type="module">const { createModel } = await $arcgis.import("@arcgis/charts-components");const FeatureLayer = await $arcgis.import("@arcgis/core/layers/FeatureLayer.js");const featureLayer = new FeatureLayer({portalItem: {id: "a8fbe2753beb4cd4aeef4d47e5e32a7c",},});const chartElement = document.querySelector("arcgis-chart");</script>5 collapsed lines</body></html> -
Use
createModel()to create a new heat chart model with the feature layer. The chart type is set toheatChart.28 collapsed lines<html><head><meta charset="utf-8" /><meta name="viewport" content="width=device-width, initial-scale=1, shrink-to-fit=no" /><title>ArcGIS Maps SDK for JavaScript Tutorials: Heat chart</title><style>html,body,arcgis-chart {height: 100%;margin: 0;}</style><!-- Load the ArcGIS Maps SDK for JavaScript from CDN --><script type="module" src="https://js.arcgis.com/5.0/"></script></head><body><arcgis-chart></arcgis-chart><script type="module">const { createModel } = await $arcgis.import("@arcgis/charts-components");const FeatureLayer = await $arcgis.import("@arcgis/core/layers/FeatureLayer.js");const featureLayer = new FeatureLayer({portalItem: {id: "a8fbe2753beb4cd4aeef4d47e5e32a7c",},});const chartElement = document.querySelector("arcgis-chart");const heatChartModel = await createModel({ layer: featureLayer, chartType: "heatChart" });</script>5 collapsed lines</body></html>
Customize the heat chart
In this section, we’ll explore how to use various properties and methods from the heat chart model together with the <arcgis-chart> component to render the heat chart. Specifically, we’ll create a calendar heat chart that visualizes the average hotel price for each day of the year.
-
First, use the
xAxisFieldandyAxisFieldproperties to set the x-axis and y-axis fields. Here, we are using thelast_reviewdate field for both axes.43 collapsed lines<html><head><meta charset="utf-8" /><meta name="viewport" content="width=device-width, initial-scale=1, shrink-to-fit=no" /><title>ArcGIS Maps SDK for JavaScript Tutorials: Heat chart</title><style>html,body,arcgis-chart {height: 100%;margin: 0;}</style><!-- Load the ArcGIS Maps SDK for JavaScript from CDN --><script type="module" src="https://js.arcgis.com/5.0/"></script></head><body><arcgis-chart></arcgis-chart><script type="module">const { createModel } = await $arcgis.import("@arcgis/charts-components");const FeatureLayer = await $arcgis.import("@arcgis/core/layers/FeatureLayer.js");const featureLayer = new FeatureLayer({portalItem: {id: "a8fbe2753beb4cd4aeef4d47e5e32a7c",},});const chartElement = document.querySelector("arcgis-chart");const heatChartModel = await createModel({ layer: featureLayer, chartType: "heatChart" });heatChartModel.xAxisField = "last_review";heatChartModel.yAxisField = "last_review";6 collapsed lines</script></body></html> -
Next, use the
numericFieldsproperty and theaggregationTypeto set the numeric field and aggregation. Here, we are using thepricefield with theavgaggregation type to visualize the average hotel price for each day over the years.43 collapsed lines<html><head><meta charset="utf-8" /><meta name="viewport" content="width=device-width, initial-scale=1, shrink-to-fit=no" /><title>ArcGIS Maps SDK for JavaScript Tutorials: Heat chart</title><style>html,body,arcgis-chart {height: 100%;margin: 0;}</style><!-- Load the ArcGIS Maps SDK for JavaScript from CDN --><script type="module" src="https://js.arcgis.com/5.0/"></script></head><body><arcgis-chart></arcgis-chart><script type="module">const { createModel } = await $arcgis.import("@arcgis/charts-components");const FeatureLayer = await $arcgis.import("@arcgis/core/layers/FeatureLayer.js");const featureLayer = new FeatureLayer({portalItem: {id: "a8fbe2753beb4cd4aeef4d47e5e32a7c",},});const chartElement = document.querySelector("arcgis-chart");const heatChartModel = await createModel({ layer: featureLayer, chartType: "heatChart" });heatChartModel.numericFields = ["price"];heatChartModel.aggregationType = "avg";6 collapsed lines</script></body></html> -
Use the
xTemporalBinningandyTemporalBinningproperties to define the temporal binning for the x-axis and y-axis. Since we want to visualize data for each day of the year, we set the x-axis binningunittodayOfMonthand the y-axis binningunittomonthOfYear.You can further customize the axis labels by using the
setAxisValueFormatmethod. Here, the x-axis is formatted to display “day of month”, while the y-axis display “month of year”.The y-axis is sorted in descending order using the
setYAxisSortOrdermethod to have January at the top and December at the bottom, which is a common layout for calendar heat charts.43 collapsed lines<html><head><meta charset="utf-8" /><meta name="viewport" content="width=device-width, initial-scale=1, shrink-to-fit=no" /><title>ArcGIS Maps SDK for JavaScript Tutorials: Heat chart</title><style>html,body,arcgis-chart {height: 100%;margin: 0;}</style><!-- Load the ArcGIS Maps SDK for JavaScript from CDN --><script type="module" src="https://js.arcgis.com/5.0/"></script></head><body><arcgis-chart></arcgis-chart><script type="module">const { createModel } = await $arcgis.import("@arcgis/charts-components");const FeatureLayer = await $arcgis.import("@arcgis/core/layers/FeatureLayer.js");const featureLayer = new FeatureLayer({portalItem: {id: "a8fbe2753beb4cd4aeef4d47e5e32a7c",},});const chartElement = document.querySelector("arcgis-chart");const heatChartModel = await createModel({ layer: featureLayer, chartType: "heatChart" });heatChartModel.xTemporalBinning = { type: "calendarDateParts", unit: "dayOfMonth" };heatChartModel.yTemporalBinning = { type: "calendarDateParts", unit: "monthOfYear" };heatChartModel.setAxisValueFormat(0, { type: "date", intlOptions: { weekday: "long" } });heatChartModel.setAxisValueFormat(1, { type: "date", intlOptions: { month: "long" } });heatChartModel.setYAxisSortOrder("Desc");6 collapsed lines</script></body></html> -
Use the
gradientRulesproperty to define color gradient rules for the chart. A gradient color from light blue to dark red is used here to represent low to high average hotel prices.minValueandmaxValueare set to 100 and 250 to focus on a specific range of average prices. Outliers outside this range will be represented by the boundary colors set byoutsideRangeLowerColorandoutsideRangeUpperColor.43 collapsed lines<html><head><meta charset="utf-8" /><meta name="viewport" content="width=device-width, initial-scale=1, shrink-to-fit=no" /><title>ArcGIS Maps SDK for JavaScript Tutorials: Heat chart</title><style>html,body,arcgis-chart {height: 100%;margin: 0;}</style><!-- Load the ArcGIS Maps SDK for JavaScript from CDN --><script type="module" src="https://js.arcgis.com/5.0/"></script></head><body><arcgis-chart></arcgis-chart><script type="module">const { createModel } = await $arcgis.import("@arcgis/charts-components");const FeatureLayer = await $arcgis.import("@arcgis/core/layers/FeatureLayer.js");const featureLayer = new FeatureLayer({portalItem: {id: "a8fbe2753beb4cd4aeef4d47e5e32a7c",},});const chartElement = document.querySelector("arcgis-chart");const heatChartModel = await createModel({ layer: featureLayer, chartType: "heatChart" });heatChartModel.gradientRules = {colorList: [[200, 225, 255, 255],[220, 0, 0, 255],],minValue: 100,maxValue: 250,outsideRangeLowerColor: [240, 248, 255, 255],outsideRangeUpperColor: [160, 30, 30, 255],};6 collapsed lines</script></body></html> -
Next, customize the heat chart title and subtitle by using the
titleTextandsubtitleTextproperties. You can also use thesetAxisTitleTextmethod to set the title for each axis.Legends can be customized by setting the
legendTitleTextproperty to provide context on the data being visualized, and thelegendPositionproperty to position the legend on the right side of the chart for better visibility.43 collapsed lines<html><head><meta charset="utf-8" /><meta name="viewport" content="width=device-width, initial-scale=1, shrink-to-fit=no" /><title>ArcGIS Maps SDK for JavaScript Tutorials: Heat chart</title><style>html,body,arcgis-chart {height: 100%;margin: 0;}</style><!-- Load the ArcGIS Maps SDK for JavaScript from CDN --><script type="module" src="https://js.arcgis.com/5.0/"></script></head><body><arcgis-chart></arcgis-chart><script type="module">const { createModel } = await $arcgis.import("@arcgis/charts-components");const FeatureLayer = await $arcgis.import("@arcgis/core/layers/FeatureLayer.js");const featureLayer = new FeatureLayer({portalItem: {id: "a8fbe2753beb4cd4aeef4d47e5e32a7c",},});const chartElement = document.querySelector("arcgis-chart");const heatChartModel = await createModel({ layer: featureLayer, chartType: "heatChart" });heatChartModel.titleText = "Average Price of NYC Hotels";heatChartModel.subtitleText = "Grouped by Month of Year and Day of Month";heatChartModel.setAxisTitleText("Day of Month", 0);heatChartModel.setAxisTitleText("Month", 1);heatChartModel.legendTitleText = "Average Price (USD)";heatChartModel.legendPosition = "right";6 collapsed lines</script></body></html> -
Set the
modelproperty of thechartElementto theheatChartModelto apply the configurations and render the chart.43 collapsed lines<html><head><meta charset="utf-8" /><meta name="viewport" content="width=device-width, initial-scale=1, shrink-to-fit=no" /><title>ArcGIS Maps SDK for JavaScript Tutorials: Heat chart</title><style>html,body,arcgis-chart {height: 100%;margin: 0;}</style><!-- Load the ArcGIS Maps SDK for JavaScript from CDN --><script type="module" src="https://js.arcgis.com/5.0/"></script></head><body><arcgis-chart></arcgis-chart><script type="module">const { createModel } = await $arcgis.import("@arcgis/charts-components");const FeatureLayer = await $arcgis.import("@arcgis/core/layers/FeatureLayer.js");const featureLayer = new FeatureLayer({portalItem: {id: "a8fbe2753beb4cd4aeef4d47e5e32a7c",},});const chartElement = document.querySelector("arcgis-chart");const heatChartModel = await createModel({ layer: featureLayer, chartType: "heatChart" });chartElement.model = heatChartModel;7 collapsed lines</script></body></html>
Switch between gradient and class-break legend
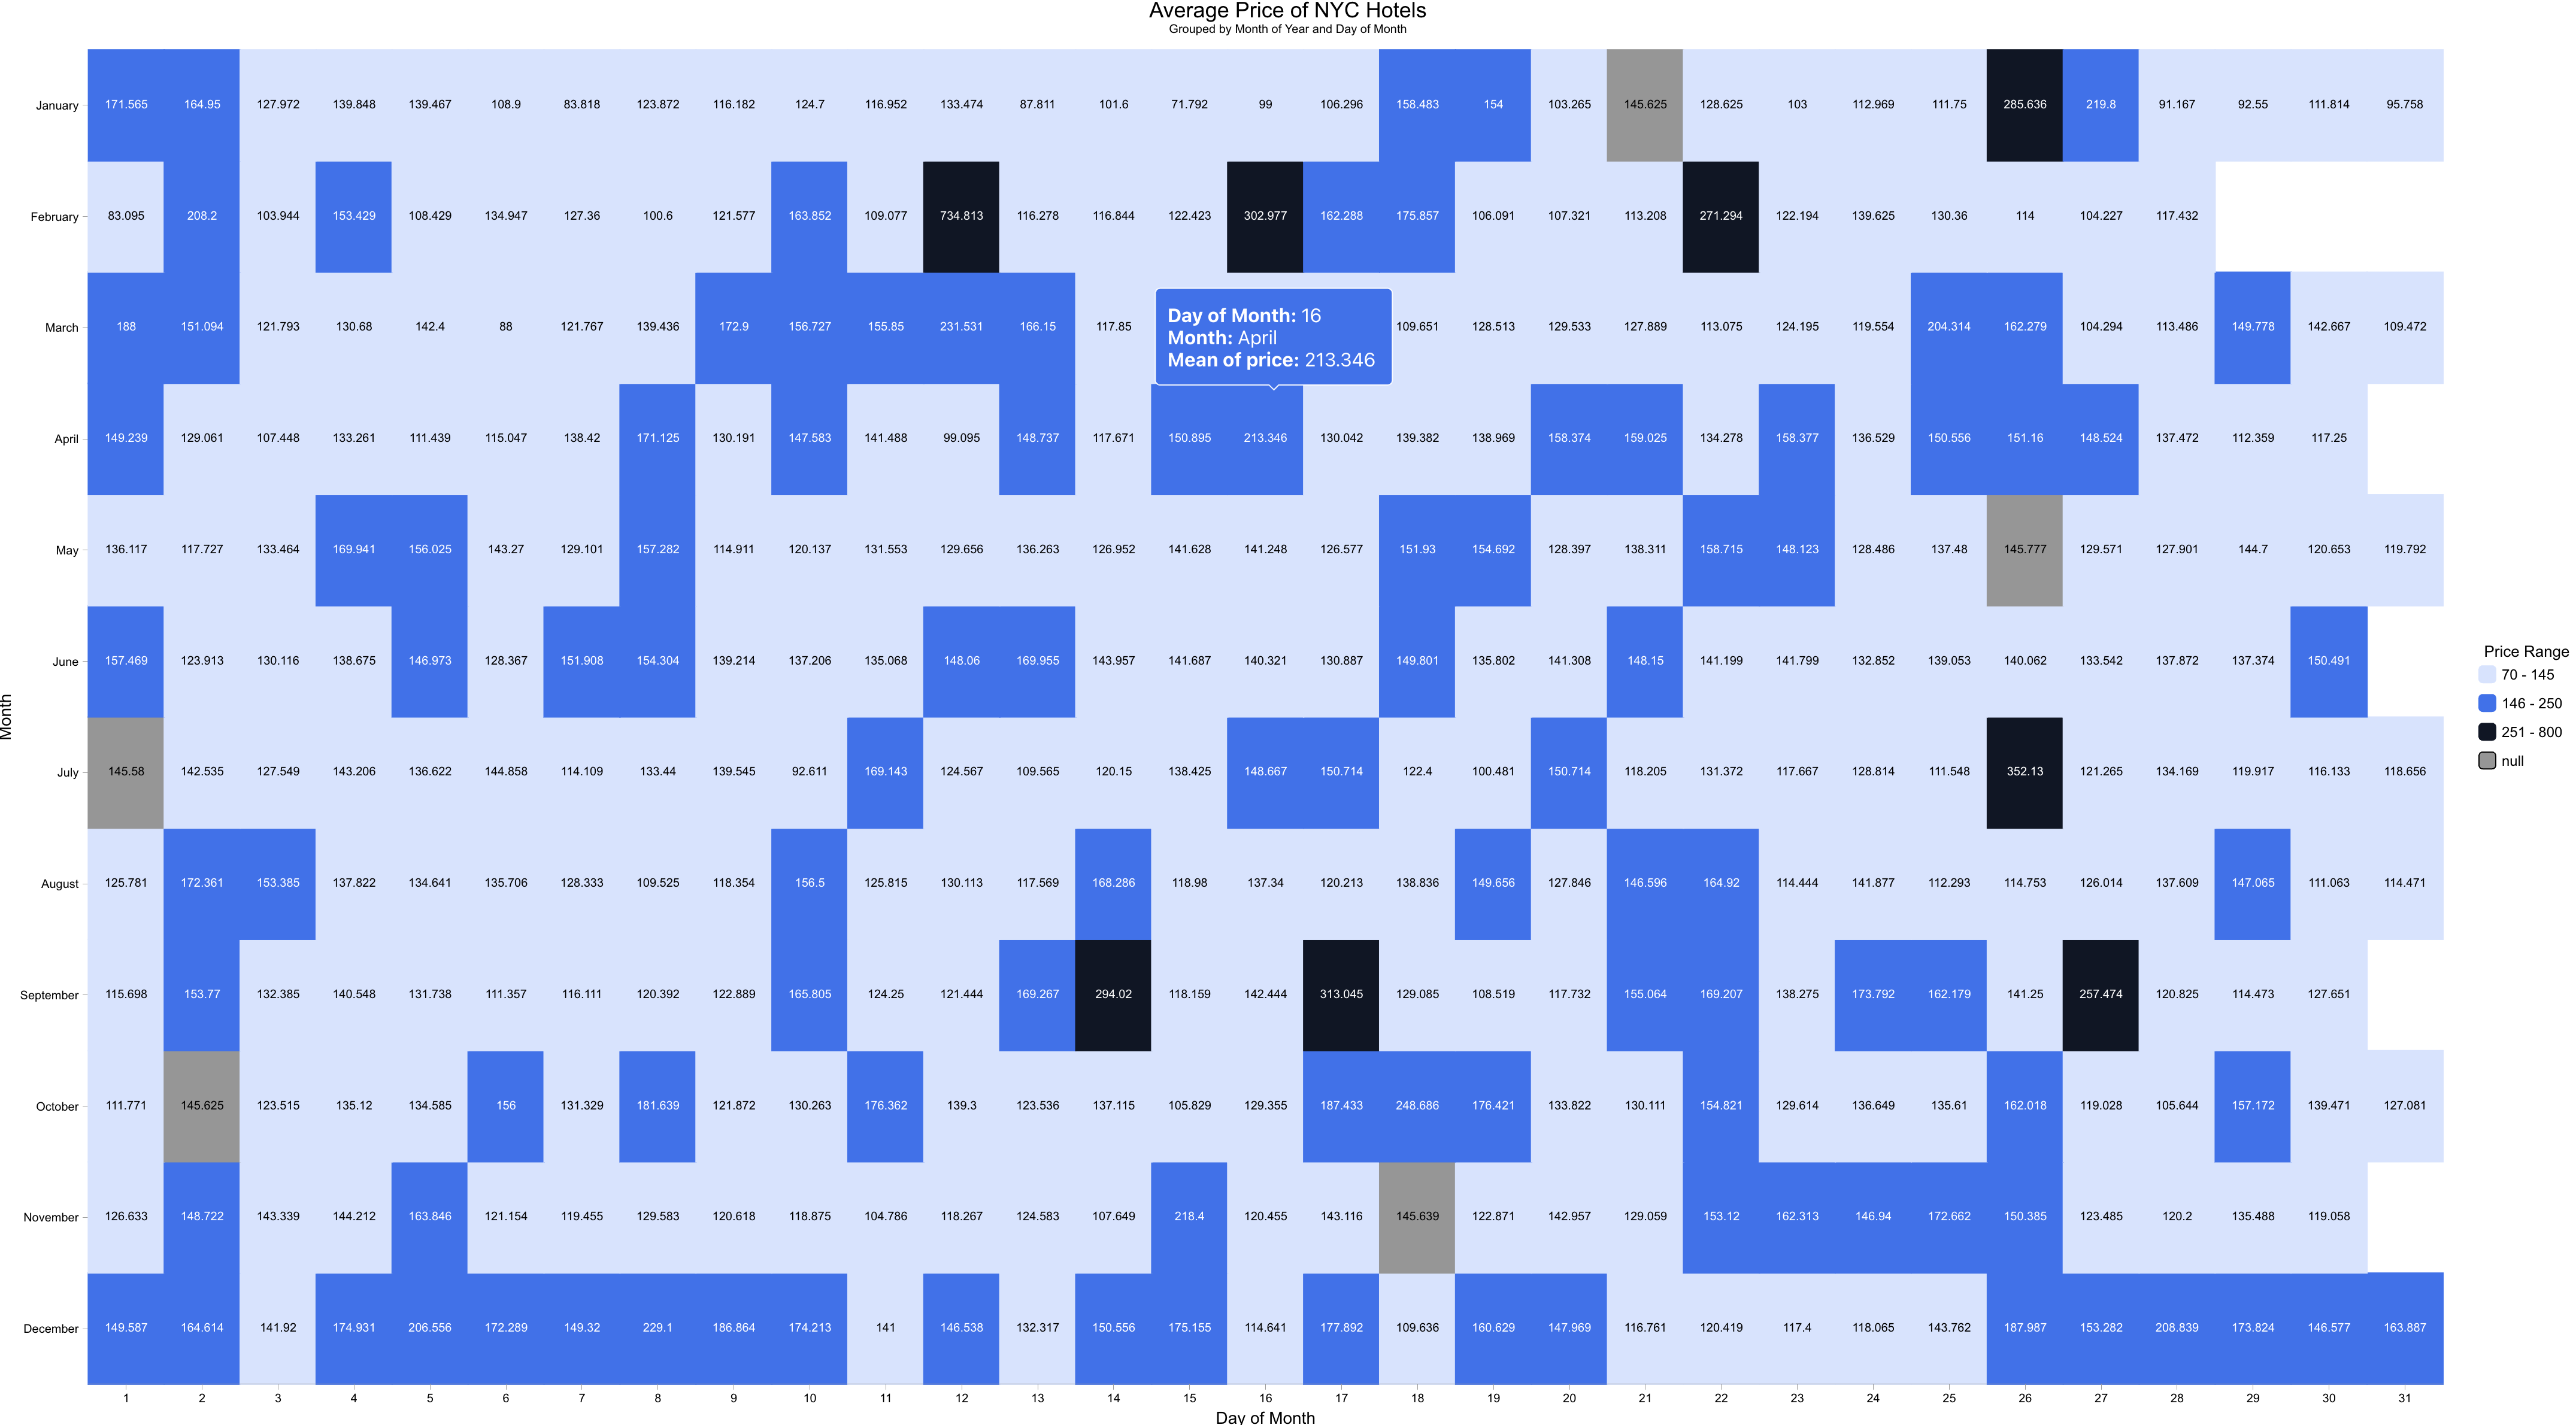
By default, heat chart uses a gradient legend to represent the color scale. You can switch to a class-break legend by setting the heatRulesType property of the heat chart model to "renderer".
When using a class-break legend, you can remove the gradientRules property as it is not needed.
-
To switch to a class-break legend, first set the
heatRulesTypeproperty to"renderer".heatChartModel.heatRulesType = "renderer"; -
Next, you will need to define the
chartRendererproperty of the heat chart model to specify the class breaks and corresponding colors.In this example, three class breaks are defined to represent different ranges of average hotel prices with distinct colors.
heatChartModel.chartRenderer = {"type": "classBreaks","field": "arcgis_charts_heat_chart_value","classBreakInfos": [{"label": "70 - 145","classMinValue": 70,"classMaxValue": 145,"symbol": {"type": "esriSFS","color": [212,227,255,255],"style": "esriSFSSolid"}},{"label": "146 - 250","classMinValue": 146,"classMaxValue": 250,"symbol": {"type": "esriSFS","color": [43,108,240,255],"style": "esriSFSSolid"}},{"label": "251 - 800","classMinValue": 251,"classMaxValue": 800,"symbol": {"type": "esriSFS","color": [14,22,37,255],"style": "esriSFSSolid"}}]};
Run the app
In CodePen, you should see a calendar heat chart that visualizes the average hotel price for each day of the year, with colors representing different price ranges. From the heat chart, you can easily identify patterns such as peak seasons and price fluctuations throughout the year.
What’s next?
Learn how to use additional SDK features and ArcGIS services in these tutorials: