import DotDensityRenderer from "@arcgis/core/renderers/DotDensityRenderer.js";const DotDensityRenderer = await $arcgis.import("@arcgis/core/renderers/DotDensityRenderer.js");- Since
- ArcGIS Maps SDK for JavaScript 4.11
DotDensityRenderer allows you to create dot density visualizations for polygon layers. Dot density visualizations randomly draw dots within each polygon to visualize the density of a population or some other variable. Each dot represents an approximate numeric value of an attribute or a subset of attributes. Unlike choropleth maps, field values used in dot density visualizations don't need to be normalized because the size of the polygon, together with the number of dots rendered within its boundaries, indicate the spatial density of that value. In essence, the empty space between the dots acts as a form of data normalization.
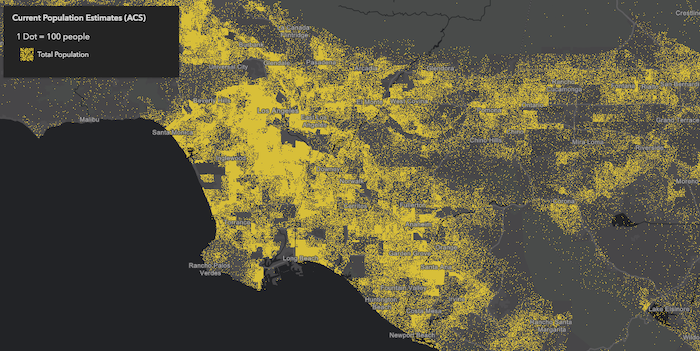
The image below visualizes population by Census tract using dot density. Notice that each dot represents about 100 people.
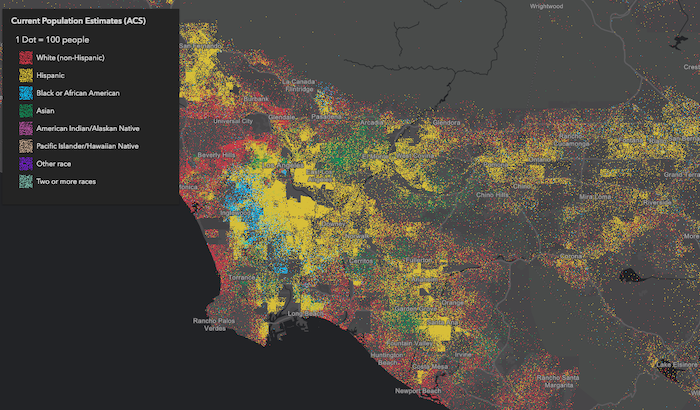
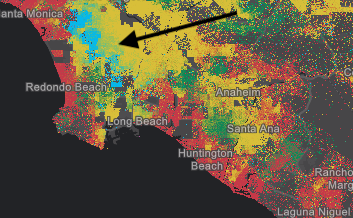
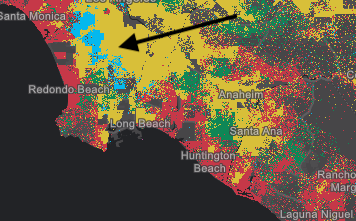
You can specify multiple attributes to visualize subcategories of the data. For example, we can visualize the same layer above, but categorize each dot by race/ethnicity. So each dot of a different color represents 100 people of the respective category (e.g. 1 red dot represents 100 white non-Hispanic) people, each blue dot = 100 African American people, each yellow dot = 100 Hispanic people, etc).
This implementation of dot density allows you to linearly scale the dot value based on the view scale. So as you zoom in and out of the initial view, the relative density of points remains the same across scales.
Usage guidelines
Keep in mind the following suggestions while creating dot density visualizations:
- You should use Equal Area spatial references whenever possible, particularly when building dot density visualizations that span global extents. Using heavily distorted spatial references with a DotDensityRenderer is OK as long as you restrict the user from comparing the densities of features within the same view at large scales. We strongly discourage comparing features across multiple views when equal area projections cannot be used since significant differences in area distortion may cause the user to misinterpret feature density in heavily distorted areas.
- You should typically set a FeatureLayer.minScale on the layer. Dot density visualizations are difficult to read when dots are no longer distinguishable either because they coalesce, or because they are too dispersed.
- Setting a FeatureLayer.maxScale on the layer is also important because dot density maps tend to become unreadable at larger scales.
Users may start seeing patterns in the random distribution of dots that do not exist in reality. They may
also mistakenly interpret the location of each dot as an actual point feature. Users are particularly susceptible to this when
the dotValue is set to
1. As an example, dot density visualizations on county datasets should only be viewed at the state or regional level. - Use the attributes property to specify one or more data values. When multiple attributes are specified, the group of attributes should make sense when visualized together, and generally should belong to a parent group. For example, you could map the density of pets, or the density of different kinds of pets such as dogs, cats, etc.
- The dot count inside a polygon is created using a stochastic dot density fast approximation,
and doesn't necessarily represent an exact count or population. Therefore, dot density should not be used to infer the
locations of actual populations, nor should map authors
expect users to count the number of dots to learn the exact value of a feature, even if the
dotValueis set to1. The popup or label should be used to communicate exact values to support the spatial pattern established by the visualization. Dot density visualizations work best at communicating patterns and relative densities of populations that inherently have a margin of error (such as U.S. Census data), and don't necessarily represent a precise or exact count. - Use popups to clearly communicate the actual value of the feature, so the user can explore the map visually and interactively.
Known Limitations
This renderer may only be applied to layers with a geometryType of polygon.
This renderer is currently only supported in 2D MapViews.
Example
layer.renderer = { type: "dot-density", // autocasts as new DotDensityRenderer() dotValue: 1000, // 1 dot = 1,000 people when the view.scale is 1:1,000,000 referenceScale: 1000000, // view.scale attributes: [{ field: "ELEMENTARY_SCHOOL", label: "Elementary School", color: "red" }, { field: "MIDDLE_SCHOOL", label: "Middle School", color: "blue" }, { field: "HIGH_SCHOOL", label: "High School", color: "orange" }, { valueExpression: "$feature.ASSOCIATES_DEGREE + $feature.BACHELOR_DEGREE + $feature.MASTER_DEGREE + $feature.DOCTORATE_DEGREE", valueExpressionTitle: "People who completed university", label: "University" color: "green" }]}Constructors
Constructor
Parameters
| Parameter | Type | Description | Required |
|---|---|---|---|
| properties | | |
Example
// Typical usagelet renderer = { type: "dot-density", // autocasts as new DotDensityRenderer() dotValue: 1000, legendOptions: { unit: "people" }, attributes: [{ field: "Population", color: "yellow" }]};Properties
| Property | Type | Class |
|---|---|---|
| | ||
authoringInfo inherited | ||
| | ||
declaredClass readonly inherited | ||
| | ||
| | ||
| | ||
| | ||
| | ||
| | ||
| | ||
type readonly | "dot-density" | |
SizeVariable[] | null | undefined | |
attributes
- Type
- AttributeColorInfo[]
Defines the variable(s) used to visualize density. This is an array of objects, each of which references a numeric field value or Arcade expression used to drive the density. You must also set a color corresponding to each value.
If you set a single attribute, POPULATION and match it with a color black and the dotValue
is 100, then number of black dots rendered for each feature will approximately equal the value of
POPULATION divided by 100.
This property is limited to no more than 8 attributes.
- See also
Example
renderer.attributes = [{ field: "POPULATION", label: "Population (2019)", color: "gray"}]; authoringInfo
- Type
- AuthoringInfo | null | undefined
Authoring metadata only included in renderers generated from one of the Smart Mapping creator methods, such as sizeRendererCreator.createContinuousRenderer() or colorRendererCreator.createContinuousRenderer(). This includes information from UI elements such as sliders and selected classification methods and themes. This allows the authoring clients to save specific overridable settings so that next time it is accessed via the UI, their selections can be remembered.
backgroundColor
- Type
- Color
The color used to shade the polygon fill behind the dots. This can be autocast with a named string; hex string;
array of rgb or rgba values; an
object with r, g, b, and a properties; or a Color object.
- Default value
- [0, 0, 0, 0.25] - black, semitransparent
Examples
// CSS color stringrenderer.backgroundColor = "dodgerblue";// HEX stringrenderer.backgroundColor = "#33cc33";// array of RGBA valuesrenderer.backgroundColor = [51, 204, 51, 0.3];// object with rgba propertiesrenderer.backgroundColor = { r: 51, g: 51, b: 204, a: 0.7}; dotBlendingEnabled
- Type
- boolean
Only applicable when two or more attributes are specified. When true,
indicates that colors for overlapping dots will blend. For example, in a feature where
a high density of blue dots exist on top of a high density of red dots, some of the dots may
appear as purple dots if this property is true. When false only one color will be favored over
the others in rendering.
| Blend enabled | Blend disabled |
|---|---|
 |  |
- Default value
- true
dotSize
- Type
- number
- Since
- ArcGIS Maps SDK for JavaScript 4.23
Defines the size of the dots in points.
- Default value
- 1
Example
renderer.dotSize = 0.5; dotValue
- Type
- number
Defines the initial dot value used for visualizing density. If a referenceScale
is provided, this value indicates the value of each dot at the view.scale
matching the value in referenceScale. If referenceScale is set, the dot value will be recalculated depending on the
view scale. Note the value of dotValue will remain constant even in this scenario. The variable
dot value as displayed in the legend is recalculated using calculateDotValue().
If a referenceScale is not provided, the value specified
in this property will apply to dots at all scales.
Examples
// Indicates that 1 dot = 100 people at any view scalerenderer.dotValue = 100;renderer.legendOptions = { unit: "people"};// Indicates that 1 dot = 100 people only when the view's scale is 1:500,000// And a new dot value is computed as the scale changes.renderer.dotValue = 100;renderer.legendOptions = { unit: "people"};renderer.referenceScale = 500000; legendOptions
- Type
- DotDensityLegendOptions | null | undefined
An object providing options for configuring the renderer in the Legend.
Example
// Legend will display: "1 dot = 50 cows"renderer.dotValue = 50;renderer.legendOptions = { unit: "cows"}; outline
- Type
- SimpleLineSymbol
The outline of the polygon. When not set, this renders using the default SimpleLineSymbol. It is good practice to explicitly set this for every DotDensityRenderer. Either remove the outline altogether, or set it to a very thin, transparent style so it doesn't distract from the dot density.
Examples
// removes the default outline from the rendererrenderer.outline = null;// sets a thin, transparent outline to the rendererrenderer.outline = { color: [ 128,128,128, 0.2 ], width: 0.5};// disable the default outlinerenderer.outline = null; referenceScale
- Type
- number
When defined, the renderer will recalculate the dot value linearly based on the change in the view's scale using the calculateDotValue() method. The rendering will maintain the density of points as drawn at the provided scale across various scales. However, the dot value will change as the user zooms in or out from the provided scale value, though the value of dotValue will remain constant.
When the computed dot value reaches 1, the dot value is no longer recalculated as the user zooms further in.
Example
// Indicates that 1 dot = 100 people only when the view's scale is 1:500,000// And a new dot value is computed as the scale changes.// When the scale is 1:250,000, the dot value will be 50.renderer.dotValue = 100;renderer.legendOptions = { unit: "people"};renderer.referenceScale = 500000; seed
- Type
- number
When set to a consistent value, dot placements will be preserved for the same scale given all parameters are the same in the renderer. By design, dot placement varies for the same feature across scales. If the user desires to see a different set of dot placements for a given scale, the developer may provide an alternate seed value to recalculate the random placement of dots.
- Default value
- 1
visualVariables
- Type
- SizeVariable[] | null | undefined
An array of Size Visual Variable objects. Only one should be provided. This visual variable is used to vary the outline width based on the view.scale. See the snippet below for an example of this.
- See also
Example
renderer.visualVariables = [{ type: "size", target: "outline", valueExpression: "$view.scale", stops: [ { size: 1.5, value: 1881217}, { size: 0.75, value: 5878804}, { size: 0.375, value: 23515218}, { size: 0, value: 47030436}, ]}];Methods
fromJSON
- Signature
-
fromJSON (json: any): any
Creates a new instance of this class and initializes it with values from a JSON object
generated from an ArcGIS product. The object passed into the input json
parameter often comes from a response to a query operation in the REST API or a
toJSON()
method from another ArcGIS product. See the Using fromJSON()
topic in the Guide for details and examples of when and how to use this function.
Parameters
| Parameter | Type | Description | Required |
|---|---|---|---|
| json | A JSON representation of the instance in the ArcGIS format. See the ArcGIS REST API documentation for examples of the structure of various input JSON objects. | |
- Returns
- any
Returns a new instance of this class.
calculateDotValue
- Signature
-
calculateDotValue (scale: number): number
Calculates an updated dot value for the given scale for the cases where a referenceScale is provided. This allows the Legend to update the dot value as the user zooms in or out in the view.
clone
- Signature
-
clone (): DotDensityRenderer
Creates a deep clone of the renderer.
- Returns
- DotDensityRenderer
A deep clone of the object that invoked this method.
Example
// Creates a deep clone of the first layer's rendererlet renderer = view.map.layers.at(0).renderer.clone(); toJSON
- Signature
-
toJSON (): any
Converts an instance of this class to its ArcGIS portal JSON representation. See the Using fromJSON() guide topic for more information.
- Returns
- any
The ArcGIS portal JSON representation of an instance of this class.