import { createVisualVariable, createContinuousRenderer, createClassBreaksRenderer, createPCTrueColorRenderer, createPCContinuousRenderer } from "@arcgis/core/smartMapping/renderers/color.js";const { createVisualVariable, createContinuousRenderer, createClassBreaksRenderer, createPCTrueColorRenderer, createPCContinuousRenderer } = await $arcgis.import("@arcgis/core/smartMapping/renderers/color.js");- Since
- ArcGIS Maps SDK for JavaScript 4.2
This object contains helper methods for generating data-driven visualizations with continuous color or class breaks based on a field value or expression from features in a Layer. The methods in this module generate renderer or visual variable objects that may be applied directly to a supported layer. The renderers specify how features should be visualized based on data values and colors compatible with the view's background.
Known Limitations
SceneLayers must have the supportsRenderer and supportsLayerQuery capabilities enabled unless a predefined statistics object is provided to the statistics parameter of the method. To check a SceneLayer's capabilities, use the SceneLayer.getFieldUsageInfo() method.
You cannot generate renderers and visual variables using SQL expressions for client-side FeatureLayers
in a SceneView.
- See also
Functions
createVisualVariable
This method generates a color visual variable with default stops that are optimally chosen based on the statistics queried for the indicated field or expression and colors determined by the view's background.
There are two different ways this method may be called. The most common case is by
providing a layer, view, field, and theme. This is the scenario where
the statistics of the data aren't well known and the user doesn't know what colors
to use. You can optionally use a valueExpression instead of a field to visualize
features based on a numeric value returned from a script executed at runtime.
The other options are provided for convenience for more involved custom visualization authoring
applications. For example, if you already generated statistics in another operation, you
can pass the object in the statistics parameter to avoid making an extra call to the server.
You can also provide a colorScheme if you don't want one picked for you. In this case the view and
theme options would be ignored.
- Signature
-
createVisualVariable (parameters: VisualVariableParameters): Promise<VisualVariableResult>
Parameters
| Parameter | Type | Description | Required |
|---|---|---|---|
| parameters | Input parameters for generating a color visual variable based on data returned from a given field or expression. | |
- Returns
- Promise<VisualVariableResult>
Resolves to an instance of VisualVariableResult.
Examples
let layer = new FeatureLayer({  url: "https://services.arcgis.com/V6ZHFr6zdgNZuVG0/arcgis/rest/services/counties_politics_poverty/FeatureServer/0"});
// visualization based on field and normalization fieldlet colorParams = {  layer: layer,  view: view,  field: "POP_POVERTY",  normalizationField: "TOTPOP_CY",  theme: "above-and-below"};
// when the promise resolves, apply the visual variable to the renderercolorRendererCreator.createVisualVariable(colorParams)  .then(function(response){    let renderer = layer.renderer.clone();    renderer.visualVariables = [ response.visualVariable ];    layer.renderer = renderer;  });
let layer = new FeatureLayer({ url: "https://services.arcgis.com/V6ZHFr6zdgNZuVG0/arcgis/rest/services/counties_politics_poverty/FeatureServer/0"});
// visualization based off Arcade expressionlet colorParams = { layer: layer, view: view, valueExpression: "($feature.POP_POVERTY / $feature.TOTPOP_CY) * 100", sqlWhere: "TOTPOP_CY > 0", legendOptions: { title: "% of people living in poverty" }};
// when the promise resolves, apply the visual variable to the renderercolorRendererCreator.createVisualVariable(colorParams) .then(function(response){ let renderer = layer.renderer.clone(); renderer.visualVariables = [ response.visualVariable ]; layer.renderer = renderer; }); createContinuousRenderer
Generates a Renderer that may be applied directly to the layer used to call this method. The renderer contains a continuous color visual variable that maps optimal colors based on the view's background to specific stop values based on queried statistics from the indicated field or expression.
In most cases you will provide a layer, view, field, and theme to generate this renderer.
This is a scenario in which
the statistics of the data aren't well known and the user doesn't know what colors
to use in the visualization. You can also use a valueExpression instead of a field to visualize
features based on a value returned from a script executed at runtime.
The other options are provided for convenience for more involved custom visualization authoring
applications. For example, if you already generated statistics in another operation, you
can pass the statistics object to the statistics parameter to avoid making an extra call to the server.
- Signature
-
createContinuousRenderer (parameters: ContinuousRendererParameters): Promise<ContinuousRendererResult>
Parameters
| Parameter | Type | Description | Required |
|---|---|---|---|
| parameters | Input parameters for generating a continuous color visualization based on data returned from a given field or expression. | |
- Returns
- Promise<ContinuousRendererResult>
Resolves to an instance of ContinuousRendererResult.
Examples
let layer = new FeatureLayer({  url: "https://services.arcgis.com/V6ZHFr6zdgNZuVG0/arcgis/rest/services/counties_politics_poverty/FeatureServer/0"});
// visualization based on field and normalization fieldlet colorParams = {  layer: layer,  view: view,  field: "POP_POVERTY",  normalizationField: "TOTPOP_CY",  theme: "above-and-below"};
// when the promise resolves, apply the renderer to the layercolorRendererCreator.createContinuousRenderer(colorParams)  .then(function(response){    layer.renderer = response.renderer;  });
let layer = new FeatureLayer({ url: "https://services.arcgis.com/V6ZHFr6zdgNZuVG0/arcgis/rest/services/counties_politics_poverty/FeatureServer/0"});
// visualization based off Arcade expressionlet colorParams = { layer: layer, valueExpression: "($feature.POP_POVERTY / $feature.TOTPOP_CY) * 100", view: view, sqlWhere: "TOTPOP_CY > 0", legendOptions: { title: "% of people living in poverty" }};
// when the promise resolves, apply the renderer to the layercolorRendererCreator.createContinuousRenderer(colorParams) .then(function(response){ layer.renderer = response.renderer; }); createClassBreaksRenderer
- Since
- ArcGIS Maps SDK for JavaScript 4.6
Generates a ClassBreaksRenderer that may be applied directly to the
layer used to call this method. The resulting renderer defines the symbol color of each feature
based on the value of the given field value. A default color scheme is determined based on the view's background.
Depending on the classificationMethod, class breaks (or data ranges) are generated based on the statistics of the data.
Each feature is assigned a color based on the class break in which the value of the field falls.
In most cases you will provide a layer, view, field, and classificationMethod to generate this renderer.
This is a scenario in which
the statistics of the data aren't well known and the user doesn't know what colors
to use in the visualization. You can also use a valueExpression instead of a field to visualize
features based on a value returned from a script executed at runtime.
The other options are provided for convenience for more involved custom visualization authoring applications.
- Signature
-
createClassBreaksRenderer (parameters: ClassBreaksRendererParameters): Promise<ClassBreaksRendererResult>
Parameters
| Parameter | Type | Description | Required |
|---|---|---|---|
| parameters | Input parameters for generating a classed color visualization based on data returned from a given field or expression. | |
- Returns
- Promise<ClassBreaksRendererResult>
Resolves to an instance of ClassBreaksRendererResult.
Examples
let layer = new FeatureLayer({  url: "https://services.arcgis.com/V6ZHFr6zdgNZuVG0/arcgis/rest/services/counties_politics_poverty/FeatureServer/0"});
// visualization based on field and normalization fieldlet colorParams = {  layer: layer,  view: view,  field: "POP_POVERTY",  normalizationField: "TOTPOP_CY",  classificationMethod: "quantile",  numClasses: 4};
// when the promise resolves, apply the renderer to the layercolorRendererCreator.createClassBreaksRenderer(colorParams)  .then(function(response){    layer.renderer = response.renderer;  });
let layer = new FeatureLayer({ url: "https://services.arcgis.com/V6ZHFr6zdgNZuVG0/arcgis/rest/services/counties_politics_poverty/FeatureServer/0"});
// visualization based off Arcade expressionlet colorParams = { layer: layer, valueExpression: "($feature.POP_POVERTY / $feature.TOTPOP_CY) * 100", view: view, sqlWhere: "TOTPOP_CY > 0", legendOptions: { title: "% of people living in poverty" }};
// when the promise resolves, apply the renderer to the layercolorRendererCreator.createClassBreaksRenderer(colorParams) .then(function(response){ layer.renderer = response.renderer; }); createPCTrueColorRenderer
- Since
- ArcGIS Maps SDK for JavaScript 4.5
Generates a PointCloudRGBRenderer based on the RGB field of a given
PointCloudLayer. This method simplifies the
experience of creating a PointCloudRGBRenderer manually. All that's required is
a layer instance. You can optionally set the size and density
of the points to suit the needs of the desired visualization.
- Signature
-
createPCTrueColorRenderer (parameters: PCTrueColorRendererParameters): Promise<PCTrueColorRendererResult>
Parameters
| Parameter | Type | Description | Required |
|---|---|---|---|
| parameters | Input parameters for generating a true color visualization based on the | |
- Returns
- Promise<PCTrueColorRendererResult>
Resolves to an object containing the renderer to set on the input layer. See PCTrueColorRendererResult for more details.
Examples
let layer = new PointCloudLayer({  url: "https://tiles.arcgis.com/tiles/V6ZHFr6zdgNZuVG0/arcgis/rest/services/BARNEGAT_BAY_LiDAR_UTM/SceneServer"});
// generates an RGB renderer using default values for the given layer.colorRendererCreator.createPCTrueColorRenderer({  layer: layer}).then(function(response){  layer.renderer = response.renderer;});
let layer = new PointCloudLayer({ url: "https://tiles.arcgis.com/tiles/V6ZHFr6zdgNZuVG0/arcgis/rest/services/BARNEGAT_BAY_LiDAR_UTM/SceneServer"});
// sets options for configuring size of pointslet parameters = { layer: layer, density: 25, // points per square inch size: "100%" // minimizes gap between points};
// when the promise resolves, apply the renderer to the layercolorRendererCreator.createPCTrueColorRenderer(parameters) .then(function(response){ layer.renderer = response.renderer; }); createPCContinuousRenderer
- Since
- ArcGIS Maps SDK for JavaScript 4.5
Generates a PointCloudStretchRenderer with a color scheme best-suited for the view's background based on statistics returned from a given field of a PointCloudLayer. All that's required is a layer instance, field name, and basemap id. You can optionally set the size and density of the points to suit the needs of the desired visualization.
- Signature
-
createPCContinuousRenderer (parameters: PCContinuousRendererParameters): Promise<PCContinuousRendererResult>
Parameters
| Parameter | Type | Description | Required |
|---|---|---|---|
| parameters | Input parameters for generating a renderer based on the given field of the input layer. | |
- Returns
- Promise<PCContinuousRendererResult>
Resolves to an object containing the renderer to set on the input layer. See PCContinuousRendererResult for more details.
Example
let layer = new PointCloudLayer({  url: "https://tiles.arcgis.com/tiles/V6ZHFr6zdgNZuVG0/arcgis/rest/services/BARNEGAT_BAY_LiDAR_UTM/SceneServer"});
let parameters = {  layer: layer,  field: "INTENSITY",  basemap: "satellite"};
// when the promise resolves, apply the renderer to the layercolorRendererCreator.createPCContinuousRenderer(parameters)  .then(function(response){    layer.renderer = response.renderer;  });
createAgeRenderer
- Since
- ArcGIS Maps SDK for JavaScript 4.9
Generates a continuous color Renderer representing the age of features based
on one or more fields. The age of a feature is calculated based on a given startTime and endTime, one of which
must be a date field in the input layer. This method generates an Arcade expression and calculates statistics on the
output of the expression to accomplish this. The resulting
renderer contains a continuous color visual variable that maps optimal colors based on the view's background
to data values based on the resulting statistics of the expression.
You are required to provide a layer, view, startTime, and endTime to generate this renderer. Optionally, you can
set a unit and a theme for the visualization. Other options are provided for convenience for more involved custom visualization authoring
applications. For example, if you already generated statistics in another operation, you
can pass the statistics object to the statistics parameter to avoid making an extra call to the server.
- Signature
-
createAgeRenderer (parameters: AgeRendererParameters): Promise<AgeRendererResult>
Parameters
| Parameter | Type | Description | Required |
|---|---|---|---|
| parameters | Input parameters for generating a continuous color visualization of age for time data returned from start and/or end date field(s). | |
- Returns
- Promise<AgeRendererResult>
Resolves to an instance of AgeRendererResult.
Examples
const layer = new FeatureLayer({  url: "https://services.arcgis.com/V6ZHFr6zdgNZuVG0/arcgis/rest/services/311_Service_Requests_from_2015_50k/FeatureServer/0"});
// visualization based age of incidents closed passed their due date// or the number of days an incident was overdue at the time of closure.
const ageParams = {  layer: layer,  view: view,  startTime: "Due_Date",  endTime: "Closed_Date",  unit: "days",  theme: "above-and-below"};
// when the promise resolves, apply the renderer to the layercolorRendererCreator.createAgeRenderer(ageParams)  .then(function(response){    layer.renderer = response.renderer;  });
const layer = new CSVLayer({ url: "https://earthquake.usgs.gov/earthquakes/feed/v1.0/summary/2.5_week.csv", copyright: "USGS Earthquakes"});
// visualization based off current age of incidentconst ageParams = { layer: layer, view: view, startTime: "time", endTime: Date.now(), legendOptions: { title: "Time since earthquake struck" }};
// when the promise resolves, apply the renderer to the layercolorRendererCreator.createAgeRenderer(ageParams) .then(function(response){ layer.renderer = response.renderer; });Type definitions
VisualVariableParametersBase
- Supertypes
- AbortOptions
layer
- Type
- SupportedLayer
The layer for which the visualization
is generated. When a client-side layer type is provided, attribute and spatial statistics are calculated
only from features in the view's extent. When a server-side layer type is provided, the statistics
are calculated from the entire layer, unless a valueExpression is provided.
normalizationField
The name of the field to normalize the values of the given
field. Providing a normalization field helps minimize some visualization errors and standardizes the data
so all features are visualized with minimal bias due to area differences or count variation. This option is
commonly used when visualizing densities.
colorScheme
- Type
- ColorScheme | null | undefined
In authoring apps,
the user may select a pre-defined color scheme. Pass the scheme object to this property to avoid getting one
based on a theme and the view's background.
theme
- Type
- ColorTheme | null | undefined
Determines which values will be emphasized in the continuous ramp and the map. Possible values are listed below.
| Value | Description | Example |
|---|---|---|
| high-to-low | High values are emphasized with strong colors. The data values above one standard deviation from the mean are assigned the strongest color. Data values below one standard deviation from the mean are assigned the weakest color. All other values are interpolated. | 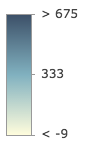 |
| above | High values are emphasized with strong colors. The max data value is assigned the strongest color. The middle or average data value is assigned the weakest color. All other values are interpolated. |  |
| below | Low values are emphasized with strong colors. The min data value is assigned the strongest color. The middle or average data value is assigned the weakest color. All other values are interpolated. |  |
| above-and-below | Values centered on a meaningful data value (e.g. the average) are visualized with weak colors while other values are emphasized with strong colors. All other values are interpolated. | 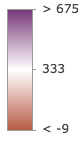 |
| centered-on | Values centered on a meaningful data value (e.g. the average) are emphasized with strong colors while other values are visualized with weak colors. All other values are interpolated. | 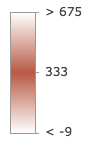 |
| extremes | High and low values are emphasized with strong colors. All others are visualized with weak colors. All other values are interpolated. | 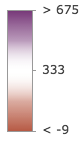 |
- Default value
- high-to-low
valueExpression
An Arcade expression following
the specification defined by the Arcade Visualization Profile.
Expressions may reference field values using the $feature profile variable and must return
a number. This property overrides the field property and therefore is used instead of an input field value.
The view parameter is required if specifying a valueExpression. When using a valueExpression, client-side
statistics are calculated based on the features in the view's extent. To generate statistics for the entire layer,
set an equivalent sqlExpression.
filter
- Type
- FeatureFilter | null | undefined
- Since
- ArcGIS Maps SDK for JavaScript 4.31
When defined, only features included in the filter
are considered in the attribute and spatial statistics calculations when determining the final renderer.
This is useful when a lot of variation exists in the data
that could result in undesired data ranges. A common use case would be to set a filter that only
includes features in the current extent of the view where the data is most likely to be viewed. Currently, only
geometry filters with an intersects spatial relationship are supported. All other filter types (including where) are ignored.
legendOptions
- Type
- IVisualVariableLegendOptions | null | undefined
Provides options for setting a title to a field when an expression is provided instead of a field name. This title will represent the field in the Legend.
statistics
- Type
- SummaryStatisticsResult | null | undefined
A statistics object generated from the summaryStatistics function. If statistics for the field have already been generated, then pass the object here to avoid making a second statistics query to the server.
forBinning
Indicates whether the generated renderer is for a binning or clustering visualization.
If true, then the input field(s) in this method should refer to aggregate fields defined in the featureReduction property of the layer.
view
- Type
- MapViewOrSceneView | null | undefined
The view where the input layer is rendered. This method
inspects the view's background (i.e. basemap, web map background, or view container) to determine optimal
colors for the output renderer. This parameter should always be set in practice, but if not provided this method
will assume the generated renderer will display on a light background. This parameter is required when creating
renderers using a valueExpression or for renderers intended for display in a SceneView.
VisualVariableResultBase
visualVariable
- Type
- ColorVariable
A color visual variable configured based on the statistics of the data and the background of the view.
defaultValuesUsed
- Type
- boolean
Indicates whether default values are used in the absence of sufficient data and/or statistics from the layer. Default values are typically used when all features have the same field value or no value at all.
basemapTheme
- Type
- BasemapTheme | null | undefined
Indicates whether the average color of the input view's basemap is light or dark.
VisualVariableParameters
- Supertypes
- VisualVariableParametersBase
layer
The layer for which the visualization
is generated. When a client-side layer type is provided, attribute and spatial statistics are calculated
only from features in the view's extent. When a server-side layer type is provided, the statistics
are calculated from the entire layer, unless a valueExpression is provided.
VisualVariableResult
The result object of the createVisualVariable() method. See the table below for details of each property.
- Supertypes
- VisualVariableResultBase
authoringInfo
- Type
- AuthoringInfo
Authoring information related to the creation of the visual variable. This includes information related to UI inputs from sliders and selected themes.
ContinuousRendererParameters
- Supertypes
- VisualVariableParametersBase
layer
The layer for which the visualization
is generated. When a client-side layer type is provided, attribute and spatial statistics are calculated
only from features in the view's extent. When a server-side layer type is provided, the statistics
are calculated from the entire layer, unless a valueExpression is provided.
symbolType
- Type
- SymbolType | null | undefined
The type of symbol to generate. This depends on the view
in which you are working and the desired visualization. This parameter does not need to be specified for layers
with a mesh geometry type. Possible values are described below.
| Value | Description |
|---|---|
| 2d | Generates a visualization using 2D symbols such as SimpleMarkerSymbol, SimpleLineSymbol, or SimpleFillSymbol. Use this option if generating a visualization for data in a MapView. |
| 3d-flat | Generates a visualization using 3D symbols with flat symbol layers such as IconSymbol3DLayer, LineSymbol3DLayer, or FillSymbol3DLayer. Use this option if generating a 2D visualization for data in a SceneView. |
| 3d-volumetric | Generates a visualization using 3D symbols with volumetric symbol layers such as ObjectSymbol3DLayer, PathSymbol3DLayer, or ExtrudeSymbol3DLayer. Use this option if generating a 3D visualization for data in a SceneView. A SceneView instance must be provided to the view parameter if this option is used. |
| 3d-volumetric-uniform | Generates a visualization using uniformly sized 3D symbols with volumetric symbol layers. Use this option if generating a 3D visualization for data in a SceneView and the symbol should be sizes uniformly, for example with spheres. A SceneView instance must be provided to the view parameter if this option is used. |
- Default value
- 2d
colorMixMode
- Type
- ColorMixModeType | null | undefined
This option only applies to generating renderers for mesh SceneLayers. Specifies how the symbol's color is applied to the geometry color/texture. See the documentation in FillSymbol3DLayer.material for more context. See the table below for possible values.
| Value | Description |
|---|---|
| tint | Applies the symbol color to the unsaturated geometry/texture color. |
| replace | Removes the geometry/texture color and applies the symbol color. |
| multiply | Multiplies geometry/texture color value with the symbol color value. The result is a darker color. Multiplying with white keeps the geometry color the same. |
- Default value
- replace
outlineOptimizationEnabled
For polygon layers only. Indicates whether the
polygon outline width should vary based on view scale. When set, a valid MapView
instance must be provided in the view parameter. This option is not supported for 3D
SceneViews.
- Default value
- false
sizeOptimizationEnabled
For point and polyline layers only. Indicates whether
symbol sizes should vary based on view scale. When set, a valid MapView
instance must be provided in the view parameter. This option is not supported for 3D
SceneViews.
- Default value
- false
ContinuousRendererResult
The result object of the createContinuousRenderer() method. See the table below for details of each property.
- Supertypes
- VisualVariableResultBase
renderer
- Type
- ClassBreaksRenderer
The renderer object configured to best
match the view's background and the spread of the data. Set this on a layer's renderer property
(or the featureReduction.renderer property to update its visualization.
ClassBreaksRendererParameters
- Supertypes
- AbortOptions
layer
The layer for which the visualization
is generated. When a client-side layer type is provided, attribute and spatial statistics are calculated
only from features in the view's extent. When a server-side layer type is provided, the statistics
are calculated from the entire layer, unless a valueExpression is provided.
valueExpression
An Arcade expression following
the specification defined by the Arcade Visualization Profile.
Expressions may reference field values using the $feature profile variable and must return
a number. This property overrides the field property and therefore is used instead of an input field value.
The view parameter is required if specifying a valueExpression. When using a valueExpression, client-side
statistics are calculated based on the features in the view's extent.
normalizationType
- Type
- NormalizationType | null | undefined
Indicates how the data is normalized.
The data value obtained from the field
is normalized in one of the following ways before it is compared with the class breaks. See the
table below for a list of possible values.
| Possible Value | Description |
|---|---|
| field | Divides the field value by the value of normalizationField. This value is set by default if the normalizationField is provided. |
| log | Computes the base 10 logarithm of the data value. This can be a useful approach for some data distributions because it reduces the influence of very large data values. |
| percent-of-total | Divides the data value by the sum of all data values then multiplies by 100. Use normalizationTotal to define the total value by which to normalize. This value is set by default if the normalizationTotal is provided. |
With the exception of log normalization, data normalization creates a ratio by dividing two values.
When comparing attribute values between features, normalization minimizes the effect of varying
map areas and the number of observations. For example, dividing the 18 to 30 year old population by the
area of a polygon feature yields a density value that can be compared evenly with other features,
regardless of their size.
normalizationField
The name of the field to normalize the values of the given
field. Providing a normalization field helps minimize some visualization errors and standardizes the data
so all features are visualized with minimal bias due to area differences or count variation. This option is
commonly used when visualizing densities.
classificationMethod
- Type
- ClassificationMethod | null | undefined
The classification method used for generating breaks. See the table below for a list of possible values.
| Possible Value | Description |
|---|---|
| equal-interval | Divides the range of attribute values into equal-sized subranges. For example, if you specify three classes for a field whose values range from 0 to 300, this method will create three classes with ranges of 0–100, 101–200, and 201–300. Equal interval is best applied to familiar data ranges, such as percentages and temperature. This method emphasizes the amount of an attribute value relative to other values. For example, it could show if a store is part of the group of stores that make up the top one-third of all sales. |
| natural-breaks | Groups similar values that maximize the differences between classes. Features are divided into classes whose boundaries are set where there are relatively big differences in the data values. Natural breaks are data-specific classifications and not useful for comparing multiple maps built from different underlying information. |
| quantile | Assigns the same number of data values to each class. This is well suited to linearly distributed data. Because features are grouped in equal numbers in each class, the resulting map can often be misleading. Similar features can potentially be placed in adjacent classes, or features with widely different values can be put in the same class. You can minimize this distortion by increasing the number of classes. |
| standard-deviation | Creates class breaks with equal value ranges that are a proportion of the standard deviation. This is usually done at intervals of one, one-half, one-third, or one-fourth standard deviations from the mean. |
- Default value
- equal-interval
standardDeviationInterval
- Type
- StandardDeviationInterval | null | undefined
If a standard-deviation classification method is used, then this indicates the interval by which to generate class breaks.
Possible Values: 1 | 0.5 | 0.33 | 0.25
- Default value
- 1
colorScheme
- Type
- ColorScheme | null | undefined
In authoring apps, the user may select a pre-defined color scheme. Pass the scheme object to this property to avoid getting one based on the view's background.
legendOptions
- Type
- RendererLegendTitleOption | null | undefined
Provides options for setting a title to describe a field instead of using the field name. This title will represent the field in the Legend.
symbolType
- Type
- SymbolType | null | undefined
The type of symbol to generate. This depends on the view
in which you are working and the desired visualization. This parameter does not need to be specified for layers
with a mesh geometry type. Possible values are described below.
| Value | Description |
|---|---|
| 2d | Generates a visualization using 2D symbols such as SimpleMarkerSymbol, SimpleLineSymbol, or SimpleFillSymbol. Use this option if generating a visualization for data in a MapView. |
| 3d-flat | Generates a visualization using 3D symbols with flat symbol layers such as IconSymbol3DLayer, LineSymbol3DLayer, or FillSymbol3DLayer. Use this option if generating a 2D visualization for data in a SceneView. |
| 3d-volumetric | Generates a visualization using 3D symbols with volumetric symbol layers such as ObjectSymbol3DLayer, PathSymbol3DLayer, or ExtrudeSymbol3DLayer. Use this option if generating a 3D visualization for data in a SceneView. A SceneView instance must be provided to the view parameter if this option is used. |
| 3d-volumetric-uniform | Generates a visualization using uniformly sized 3D symbols with volumetric symbol layers. Use this option if generating a 3D visualization for data in a SceneView and the symbol should be sizes uniformly, for example with spheres. A SceneView instance must be provided to the view parameter if this option is used. |
- Default value
- 2d
colorMixMode
- Type
- ColorMixModeType | null | undefined
This option only applies to generating renderers for mesh SceneLayers. Specifies how the symbol's color is applied to the geometry color/texture. See the documentation in FillSymbol3DLayer.material for more context. See the table below for possible values.
| Value | Description |
|---|---|
| tint | Applies the symbol color to the unsaturated geometry/texture color. |
| replace | Removes the geometry/texture color and applies the symbol color. |
| multiply | Multiplies geometry/texture color value with the symbol color value. The result is a darker color. Multiplying with white keeps the geometry color the same. |
- Default value
- replace
outlineOptimizationEnabled
For polygon layers only. Indicates whether the
polygon outline width should vary based on view scale. When set, a valid MapView
instance must be provided in the view parameter. This option is not supported for 3D
SceneViews.
- Default value
- false
forBinning
Indicates whether the generated renderer is for a binning or clustering visualization.
If true, then the input field(s) in this method should refer to aggregate fields defined in the featureReduction property of the layer.
filter
- Type
- FeatureFilter | null | undefined
- Since
- ArcGIS Maps SDK for JavaScript 4.31
When defined, only features included in the filter
are considered in the attribute and spatial statistics calculations when determining the final renderer.
This is useful when a lot of variation exists in the data
that could result in undesired data ranges. A common use case would be to set a filter that only
includes features in the current extent of the view where the data is most likely to be viewed. Currently, only
geometry filters with an intersects spatial relationship are supported. All other filter types (including where) are ignored.
view
- Type
- MapViewOrSceneView | null | undefined
The view where the input layer is rendered. This method
inspects the view's background (i.e. basemap, web map background, or view container) to determine optimal
colors for the output renderer. This parameter should always be set in practice, but if not provided this method
will assume the generated renderer will display on a light background. This parameter is required when creating
renderers using a valueExpression or for renderers intended for display in a SceneView.
ClassBreaksRendererResult
- Since
- ArcGIS Maps SDK for JavaScript 4.6
The result object of the createClassBreaksRenderer() method. See the table below for details of each property.
renderer
- Type
- ClassBreaksRenderer
The renderer object configured to best
match the background of the view and the spread of the data. Set this on a layer's renderer property to
update its visualization.
defaultValuesUsed
- Type
- boolean
Indicates whether default values are used in the absence of sufficient data and/or statistics from the layer. Default values are typically used when all features have the same field value or no value at all.
basemapTheme
- Type
- BasemapTheme | null | undefined
Indicates whether the average color of the input view's basemap is light or dark.
classBreaksResult
- Type
- ClassBreaksResult
This object describes class breaks generated from data in a layer for a given field with a specified classification method.
PCRendererParameters
- Supertypes
- AbortOptions
layer
- Type
- PointCloudLayer | null | undefined
The layer for which the visualization is generated.
size
The size of each point expressed as a percentage. This value will determine point sizes
scaled based on the given density of points. When the value is 100%, the size
of each point is set so that it minimizes the number of gaps between neighboring points. Any value above 100%
will allow for points to overlap neighboring points scaled to the given value. Values below 100% scale point
sizes smaller so there appear to be more gaps between points.
- Default value
- 100%
PCTrueColorRendererResult
The result object of the createPCTrueColorRenderer() method. See the table below for details of each property.
PCContinuousRendererParameters
- Supertypes
- PCRendererParameters
basemap
The named string or basemap object of the Esri basemap that will be paired with the output visualization.
- Default value
- gray
colorScheme
- Type
- ColorScheme | null | undefined
In authoring apps,
the user may select a pre-defined color scheme. Pass the scheme object to this property to avoid getting one
based on the basemap.
statistics
- Type
- SummaryStatisticsResult | null | undefined
A statistics object generated from the summaryStatistics function. If statistics for the field have already been generated, then pass the stats object here to avoid making a second statistics
PCContinuousResultBase
defaultValuesUsed
- Type
- boolean
Indicates whether default values are used in the absence of sufficient data and/or statistics from the layer. Default values are typically used when all features have the same field value or no value at all.
basemapTheme
- Type
- BasemapTheme | null | undefined
Indicates whether the average color of the input view's basemap is light or dark.
PCContinuousRendererResult
The result object of the createPCContinuousRenderer() method. See the table below for details of each property.
- Supertypes
- PCContinuousResultBase
AgeRendererParameters
- Supertypes
- AbortOptions
startTime
- Type
- DateProperties
The name of the field, or a date value representing the start time in the
age calculation. If a date value is specified, then the endTime parameter must reference a Date field in the layer.
endTime
- Type
- DateProperties
The name of the field, or a date value representing the end time in the
age calculation. If a date value is specified, then the startTime parameter must reference a Date field in the layer.
view
- Type
- MapViewOrSceneView
The view where the input layer is rendered. This method inspects the view's background (i.e. basemap, web map background, or view container) to determine optimal colors for the output renderer.
unit
- Type
- SmartMappingTimeUnit | null | undefined
The time unit used to calculate the difference between endTime and startTime. If a unit
is not specified, then a suggested unit is determined based on the spread and distribution of the data.
colorScheme
- Type
- ColorScheme | null | undefined
In authoring apps,
the user may select a pre-defined color scheme. Pass the scheme object to this property to avoid getting one
based on a theme and the view's background.
theme
- Type
- ColorTheme | null | undefined
Determines which values will be emphasized in the continuous ramp and the map. Possible values are listed below.
| Value | Description | Example |
|---|---|---|
| high-to-low | High values are emphasized with strong colors. The data values above one standard deviation from the mean are assigned the strongest color. Data values below one standard deviation from the mean are assigned the weakest color. All other values are interpolated. | |
| above | High values are emphasized with strong colors. The max data value is assigned the strongest color. The middle or average data value is assigned the weakest color. All other values are interpolated. | |
| below | Low values are emphasized with strong colors. The min data value is assigned the strongest color. The middle or average data value is assigned the weakest color. All other values are interpolated. | |
| above-and-below | Values centered on a meaningful data value (e.g. the average) are visualized with weak colors while other values are emphasized with strong colors. All other values are interpolated. | |
| centered-on | Values centered on a meaningful data value (e.g. the average) are emphasized with strong colors while other values are visualized with weak colors. All other values are interpolated. | |
| extremes | High and low values are emphasized with strong colors. All others are visualized with weak colors. All other values are interpolated. | |
- Default value
- high-to-low
legendOptions
- Type
- IVisualVariableLegendOptions | null | undefined
Provides options for modifying Legend properties describing the visualization.
statistics
- Type
- SummaryStatisticsResult | null | undefined
A statistics object generated from the summaryStatistics function.
The createAgeRenderer() method generates an Arcade expression and executes a statistics query against the layer for the result of the expression.
If statistics for the expression have already been generated, then pass the object here to avoid making a second statistics
query.
symbolType
- Type
- SymbolType | null | undefined
The type of symbol to generate. This depends on the view
in which you are working and the desired visualization. This parameter does not need to be specified for layers
with a mesh geometry type. Possible values are described below.
| Value | Description |
|---|---|
| 2d | Generates a visualization using 2D symbols such as SimpleMarkerSymbol, SimpleLineSymbol, or SimpleFillSymbol. Use this option if generating a visualization for data in a MapView. |
| 3d-flat | Generates a visualization using 3D symbols with flat symbol layers such as IconSymbol3DLayer, LineSymbol3DLayer, or FillSymbol3DLayer. Use this option if generating a 2D visualization for data in a SceneView. |
| 3d-volumetric | Generates a visualization using 3D symbols with volumetric symbol layers such as ObjectSymbol3DLayer, PathSymbol3DLayer, or ExtrudeSymbol3DLayer. Use this option if generating a 3D visualization for data in a SceneView. A SceneView instance must be provided to the view parameter if this option is used. |
| 3d-volumetric-uniform | Generates a visualization using uniformly sized 3D symbols with volumetric symbol layers. Use this option if generating a 3D visualization for data in a SceneView and the symbol should be sizes uniformly, for example with spheres. A SceneView instance must be provided to the view parameter if this option is used. |
- Default value
- 2d
colorMixMode
- Type
- ColorMixModeType | null | undefined
This option only applies to generating renderers for mesh SceneLayers. Specifies how the symbol's color is applied to the geometry color/texture. See the documentation in FillSymbol3DLayer.material for more context. See the table below for possible values.
| Value | Description |
|---|---|
| tint | Applies the symbol color to the desaturated geometry/texture color. |
| replace | Removes the geometry/texture color and applies the symbol color. |
| multiply | Multiplies geometry/texture color value with the symbol color value. The result is a darker color. Multiplying with white keeps the geometry color the same. |
- Default value
- replace
outlineOptimizationEnabled
For polygon layers only. Indicates whether the
polygon outline width should vary based on view scale. When set, a valid MapView
instance must be provided in the view parameter. This option is not supported for 3D
SceneViews.
- Default value
- false
sizeOptimizationEnabled
For point and polyline layers only. Indicates whether
symbol sizes should vary based on view scale. When set, a valid MapView
instance must be provided in the view parameter. This option is not supported for 3D
SceneViews.
- Default value
- false
filter
- Type
- FeatureFilter | null | undefined
- Since
- ArcGIS Maps SDK for JavaScript 4.31
When defined, only features included in the filter
are considered in the attribute and spatial statistics calculations when determining the final renderer.
This is useful when a lot of variation exists in the data
that could result in undesired data ranges. A common use case would be to set a filter that only
includes features in the current extent of the view where the data is most likely to be viewed. Currently, only
geometry filters with an intersects spatial relationship are supported. All other filter types (including where) are ignored.
ColorTheme
- Type
- "high-to-low" | "above-and-below" | "centered-on" | "extremes" | "above" | "below"
AgeRendererResult
- Since
- ArcGIS Maps SDK for JavaScript 4.9
The result object of the createAgeRenderer() method. See the table below for details of each property.
- Supertypes
- ContinuousRendererResult
unit
- Type
- SmartMappingTimeUnit | null | undefined
The time unit used to represent age in the output renderer.