import PieChartRenderer from "@arcgis/core/renderers/PieChartRenderer.js";const PieChartRenderer = await $arcgis.import("@arcgis/core/renderers/PieChartRenderer.js");- Since
- ArcGIS Maps SDK for JavaScript 4.24
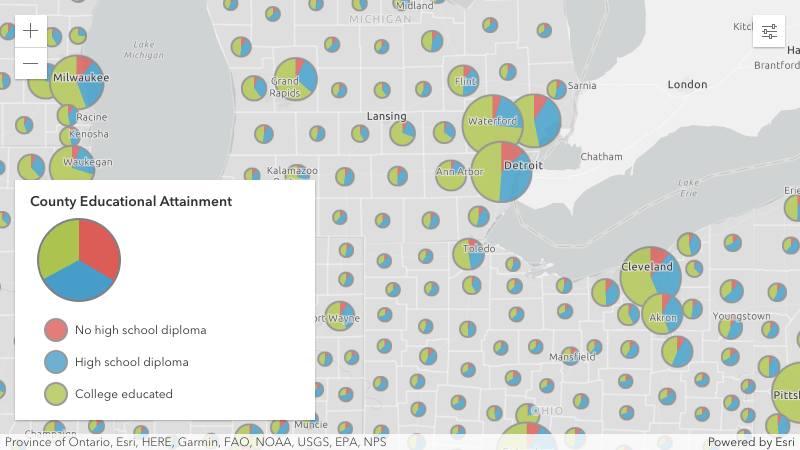
PieChartRenderer allows you to create a pie chart for each feature in the layer. The value and color of each pie slice is specified in the attributes property. You can vary the size of each pie based on data with any other field value or Arcade expression using visualVariables.
Known Limitations
PieChartRenderer is only supported in 2D MapView PieChartRenderer is only supported with the following layer types containing point or polygon geometries: FeatureLayer, CSVLayer, GeoJSONLayer, WFSLayer, and OGCFeatureLayer PieChartRenderer is not supported with FeatureReductionCluster
- See also
Example
layer.renderer = { type: "pie-chart", // autocasts as new PieChartRenderer() attributes: [{ field: "ELEMENTARY_SCHOOL", label: "Elementary School", color: "red" }, { field: "MIDDLE_SCHOOL", label: "Middle School", color: "blue" }, { field: "HIGH_SCHOOL", label: "High School", color: "orange" }, { valueExpression: "$feature.ASSOCIATES_DEGREE + $feature.BACHELOR_DEGREE + $feature.MASTER_DEGREE + $feature.DOCTORATE_DEGREE", valueExpressionTitle: "People who completed university", label: "University" color: "green" }]};Constructors
Constructor
Parameters
| Parameter | Type | Description | Required |
|---|---|---|---|
| properties | | |
Properties
| Property | Type | Class |
|---|---|---|
| | ||
authoringInfo inherited | ||
| | ||
declaredClass readonly inherited | ||
| | ||
| | ||
| | ||
| | ||
| | ||
| | ||
| | ||
type readonly | "pie-chart" | |
(SizeVariable | OpacityVariable)[] | null | undefined | |
attributes
- Type
- AttributeColorInfo[]
Defines the variable(s) to include in the pie charts. This is an array of objects, each of which references a numeric field value or Arcade expression used to drive the width of each sector. You must also set a color corresponding to each value.
This property is limited to no more than 10 attributes.
- See also
Example
renderer.attributes = [{ field: "English", label: "English speakers", color: "red"}, { field: "Spanish", label: "Spanish speakers", color: "blue"}, { field: "Other", label: "All other languages", color: "brown"}]; authoringInfo
- Type
- AuthoringInfo | null | undefined
Authoring metadata only included in renderers generated from one of the Smart Mapping creator methods, such as sizeRendererCreator.createContinuousRenderer() or colorRendererCreator.createContinuousRenderer(). This includes information from UI elements such as sliders and selected classification methods and themes. This allows the authoring clients to save specific overridable settings so that next time it is accessed via the UI, their selections can be remembered.
backgroundFillSymbol
- Type
- SimpleFillSymbol | CIMSymbol | null | undefined
The symbol used to render polygons behind the pie symbols. Only applicable to polygon layers.
Support for CIMSymbol was added at version 4.31.
Example
renderer.backgroundFillSymbol = { color: [51, 204, 51, 0.3], outline: { width: 1, color: [255,255,255,0.3] }}; defaultColor
- Type
- Color
The color used to visualize features whose attributes all have null or empty values. By default, this is a transparent color, so no chart displays. You should set this value if you would like to show areas with features, but no data associated with it.
- See also
- Default value
- new Color([0, 0, 0, 0])
Example
renderer.defaultColor = "lightgray"; defaultLabel
Describes the defaultColor in the Legend.
Example
renderer.defaultLabel = "No data"; holePercentage
- Type
- number
Use this property to create a donut chart. Defines the size of the hole to cut from the center of the chart as a percentage
of the entire pie chart. Accepted values are between 0 and 1.
For example, a hole percentage of 0 will render a full pie chart. A ratio of 0.5 will remove 50% of
the center of the pie, creating a donut.
- Default value
- 0
Example
renderer.holePercentage = 0.5; legendOptions
- Type
- RendererLegendOptions | null | undefined
An object providing options for describing the renderer in the Legend.
Example
renderer.legendOptions = { title: "Population by educational attainment", order: "descending-values",}; othersCategory
- Type
- OthersCategory | null | undefined
Defines the rules for how to aggregate small categories to a generic "others" category.
Example
// all categories that make up less than 4%// of the total will combine to an "others"// category represented with a gray color.renderer.othersCategory = { color: "gray", threshold: 0.04}; outline
- Type
- SimpleLineSymbol | null | undefined
Defines the outline of the pie chart. The outline width and color is applied to the outer outline of the pie (and inner outline in the case of donut charts).
Example
renderer.outline = { width: 0.5, color: "black"}; size
- Type
- number
Defines the size of each pie chart in points. This value may be autocast with a string expressing size in points or pixels (e.g. 12px).
- Default value
- 12
Examples
// size in pointsrenderer.size = 14;// size in pixelsrenderer.size = "20px";// size in pointsrenderer.size = "14pt"; visualVariables
- Type
- (SizeVariable | OpacityVariable)[] | null | undefined
An array of Size Visual Variable objects. Typically, this is used to vary the size of each pie chart based on the sum of all categories included in the pie.
- See also
Example
renderer.visualVariables = [{ type: "size", valueExpression: "$feature.category1 + $feature.category2 + $feature.category3", valueExpressionTitle: "Total population" minSize: 20, maxSize: 72, minDataValue: 100, maxDataValue: 1000000}];Methods
fromJSON
- Signature
-
fromJSON (json: any): any
Creates a new instance of this class and initializes it with values from a JSON object
generated from an ArcGIS product. The object passed into the input json
parameter often comes from a response to a query operation in the REST API or a
toJSON()
method from another ArcGIS product. See the Using fromJSON()
topic in the Guide for details and examples of when and how to use this function.
Parameters
| Parameter | Type | Description | Required |
|---|---|---|---|
| json | A JSON representation of the instance in the ArcGIS format. See the ArcGIS REST API documentation for examples of the structure of various input JSON objects. | |
- Returns
- any
Returns a new instance of this class.
clone
- Signature
-
clone (): this
Creates a deep clone of the renderer.
- Returns
- this
A deep clone of the object that invoked this method.
Example
// Creates a deep clone of the first layer's rendererlet renderer = view.map.layers.at(0).renderer.clone(); toJSON
- Signature
-
toJSON (): any
Converts an instance of this class to its ArcGIS portal JSON representation. See the Using fromJSON() guide topic for more information.
- Returns
- any
The ArcGIS portal JSON representation of an instance of this class.