import { createRenderer } from "@arcgis/core/smartMapping/renderers/predominance.js";const { createRenderer } = await $arcgis.import("@arcgis/core/smartMapping/renderers/predominance.js");- Since
- ArcGIS Maps SDK for JavaScript 4.9
This object contains a helper method for generating a predominance visualization. Visualizing predominance involves coloring a layer's features based on which attribute among a set of competing numeric attributes wins or beats the others in total count. Common applications of this include visualizing election results, survey results, and demographic majorities.
For example, suppose you have a layer of U.S. counties with fields containing the total sales of various crops: wheat, soybeans, corn, cotton, and vegetables. You can use the createRenderer() method in this module to generate a default visualization depicting the winner, or most predominant crop, in each county.
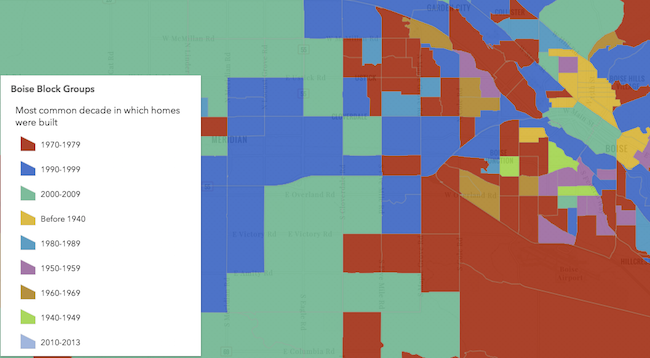
The example below depicts the predominant decade in which homes were constructed based on a city's block groups.
Known Limitations
Currently, 3D symbols can only be generated for layers with a point geometry type.
SceneLayers must have the supportsRenderer and supportsLayerQuery capabilities enabled unless a predefined statistics object is provided to the statistics parameter of the method. To check a SceneLayer's capabilities, use the SceneLayer.getFieldUsageInfo() method.
Functions
createRenderer
Generates a predominance renderer based on a set of competing numeric fields.
Visualizing predominance involves coloring a layer's features based on which attribute among a set of competing numeric attributes wins or beats the others in total count. Common applications of this include visualizing election results, survey results, and demographic majorities.
For example, suppose you have a layer of U.S. counties with fields containing the total sales of various crops: wheat, soybeans, corn, cotton, and vegetables. If a feature has the following values for each field:
| Field Name | Count | Color |
|---|---|---|
| Wheat | 130 | purple |
| Soybeans | 2000 | blue |
| Corn | 0 | yellow |
| Cotton | 300 | green |
| Vegetables | 120 | red |
Then the renderer symbolizes the feature with a blue color since Soybeans is the predominant crop.
The predominant field of a feature is determined based on the result of an Arcade expression generated
by this method. You are required to provide a layer, view, and list of fields to generate this renderer. Optionally, you can
set includeSizeVariable to true to change the size of each feature to indicate how influential the feature is compared to the entire layer
as a whole. You can also set includeOpacityVariable to true to add opacity to each feature depending on how
strong the predominant field is compared to all the other fields. For the example above, the feature would likely be
opaque since Soybeans beats all other features combined by a wide margin. If the Soybean total were still the highest, but only 301,
then the feature would be very transparent, indicating the Soybean total wins, but not by a wide margin.
Other options are provided for convenience for more involved custom visualization authoring applications.
- Signature
-
createRenderer (parameters: RendererParameters): Promise<RendererResult>
Parameters
| Parameter | Type | Description | Required |
|---|---|---|---|
| parameters | Input parameters for generating a predominance visualization based on a set of competing field(s). | |
- Returns
- Promise<RendererResult>
Resolves to an instance of RendererResult.
Example
const layer = new FeatureLayer({  url: "https://services.arcgis.com/V6ZHFr6zdgNZuVG0/arcgis/rest/services/USA_County_Crops_2007/FeatureServer/0"});
// will create a visualization of predominant crop by U.S. county
const parameter = {  layer: layer,  view: view,  fields: [{    name: "M217_07",    label: "Vegetables"  }, {    name: "M188_07",    label: "Cotton"  }, {    name: "M172_07",    label: "Wheat"  }, {    name: "M193_07",    label: "Soybeans"  }, {    name: "M163_07",    label: "Corn"  }],  includeOpacityInfo: true};
// when the promise resolves, apply the renderer to the layerpredominanceRendererCreator.createRenderer(parameters)  .then(function(response){    layer.renderer = response.renderer;  });
Type definitions
FieldInfo
label
The label describing the field name (or category) in the legend. This is should be used
if the given field doesn't have an intuitive field name. For example, for a field named dem representing the total vote count
for the Democratic party, you can set the label to Democrat to clarify the name of the category in the final visualization.
RendererParameters
- Supertypes
- AbortOptions
layer
- Type
- FeatureLikeLayerOrAdapter | null | undefined
The layer for which the visualization is generated. When a client-side layer type is provided, attribute and spatial statistics are calculated only from features in the view's extent. When a server-side layer type is provided, the statistics are calculated from the entire layer.
legendOptions
- Type
- RendererLegendTitleOption | null | undefined
Provides options for modifying Legend properties describing the visualization.
predominanceScheme
- Type
- PredominanceScheme | null | undefined
In authoring apps,
the user may select a pre-defined predominance scheme. Pass the scheme object to this property to avoid getting one based on the background of the view.
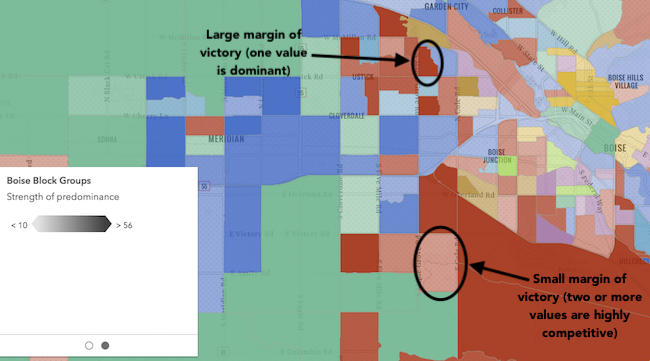
includeOpacityVariable
Indicates whether to include data-driven opacity in the final renderer. If true, features
where the predominant value beats all others by a large margin are given a high opacity. Features where the predominant value beats
others by a small margin will be assigned a low opacity, indicating that while the feature has a winning value, it doesn't win by much.
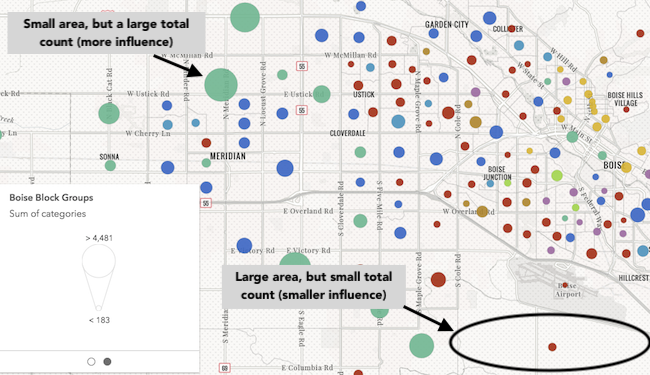
includeSizeVariable
Indicates whether to include data-driven size in the final renderer. If true, features will be assigned
a sized based on the sum of all competing values in the fields param. Features with small total counts will be sized with small icons or lines depending on
the geometry type of the layer, and features with large total counts will be sized with large icons or lines. Enabling this option
is good for visualizing how influential a particular feature is compared to the dataset as a whole. It removes bias introduced by
features with large geographic areas, but relatively small data values.
sortBy
- Type
- typeCreator.SortBy | null | undefined
Indicates how values should be sorted in the Legend. See the table below for information about values that may be passed to this parameter.
| Possible Value | Description |
|---|---|
| count | Unique values/types will be sorted from highest to lowest based on the count of features that fall in each category. |
| value | Unique values/types will be sorted in the order they were specified in the fields parameter. |
- Default value
- count
outlineOptimizationEnabled
Only for polygon layers. Indicates whether the
polygon outline width should vary based on view scale. When set, a valid MapView
instance must be provided in the view parameter. This option is not supported for 3D
SceneViews.
- Default value
- false
sizeOptimizationEnabled
Indicates whether
symbol sizes should vary based on view scale. When set, a valid MapView
instance must be provided in the view parameter. This option is not supported for 3D
SceneViews.
- Default value
- false
forBinning
Indicates whether the generated renderer is for a binning or clustering visualization.
If true, then the input field(s) in this method should refer to aggregate fields defined in the featureReduction property of the layer.
filter
- Type
- FeatureFilter | null | undefined
- Since
- ArcGIS Maps SDK for JavaScript 4.31
When defined, only features included in the filter
are considered in the attribute and spatial statistics calculations when determining the final renderer.
This is useful when a lot of variation exists in the data
that could result in undesired data ranges. A common use case would be to set a filter that only
includes features in the current extent of the view where the data is most likely to be viewed. Currently, only
geometry filters with an intersects spatial relationship are supported. All other filter types (including where) are ignored.
symbolType
- Type
- SymbolType | null | undefined
The type of symbol to generate. This depends on the view
in which you are working and the desired visualization. This parameter does not need to be specified for layers
with a mesh geometry type. Possible values are described below.
| Value | Description |
|---|---|
| 2d | Generates a visualization using 2D symbols such as SimpleMarkerSymbol, SimpleLineSymbol, or SimpleFillSymbol. Use this option if generating a visualization for data in a MapView. |
| 3d-flat | Generates a visualization using 3D symbols with flat symbol layers such as IconSymbol3DLayer, LineSymbol3DLayer, or FillSymbol3DLayer. Use this option if generating a 2D visualization for data in a SceneView. |
| 3d-volumetric | Generates a visualization using 3D symbols with volumetric symbol layers such as ObjectSymbol3DLayer, PathSymbol3DLayer, or ExtrudeSymbol3DLayer. Use this option if generating a 3D visualization for data in a SceneView. A SceneView instance must be provided to the view parameter if this option is used. |
| 3d-volumetric-uniform | Generates a visualization using uniformly sized 3D symbols with volumetric symbol layers. Use this option if generating a 3D visualization for data in a SceneView and the symbol should be sizes uniformly, for example with spheres. A SceneView instance must be provided to the view parameter if this option is used. |
- Default value
- 2d
colorMixMode
- Type
- ColorMixModeType | null | undefined
This option only applies to generating renderers for mesh SceneLayers. Specifies how the symbol's color is applied to the geometry color/texture. See the documentation in FillSymbol3DLayer.material for more context. See the table below for possible values.
| Value | Description |
|---|---|
| tint | Applies the symbol color to the desaturated geometry/texture color. |
| replace | Removes the geometry/texture color and applies the symbol color. |
| multiply | Multiplies geometry/texture color value with the symbol color value. The result is a darker color. Multiplying with white keeps the geometry color the same. |
- Default value
- replace
view
- Type
- MapViewOrSceneView | null | undefined
The view instance in which the visualization will be rendered.
RendererResult
The result object of the createRenderer() method. See the table below for details of each property.
renderer
- Type
- UniqueValueRenderer
The unique value renderer object representing
the predominance visualization. Set this on a layer's renderer property to update its visualization.
predominantCategoryInfos
- Type
- UniqueValueInfo[]
An array of objects describing the value, symbol, and count of each unique type or category represented in the renderer.
excludedCategoryInfos
- Type
- UniqueValueInfo[]
An array of objects describing the values or categories
excluded from consideration in visualizing data from the given fields. The specification of each object matches
that of the objects specified in the predominantCategoryInfos property.
size
- Type
- sizeCreator.VisualVariableResult | null | undefined
A size visual
variable representing the total count of all fields included in the predominance visualization. This is included
if the includeSizeVariable parameter is true.
opacity
- Type
- opacityCreator.VisualVariableResult | null | undefined
An opacity visual variable representing the percentage of the total count comprised by the predominant value of all fields. This variable indicates the strength of a particular value's predominance compared to the other values.
basemapTheme
- Type
- BasemapTheme | null | undefined
Indicates whether the average color of the input view's basemap is light or dark.