Learn how to use Charts components with Map components using Vite developer build tools.
In this tutorial, you will:
- Load and display a pre-configured
web map stored in ArcGIS Online with the<arcgis-map>component. - Load and display a pre-configured chart from the webmap using the
<arcgis-chart>component. - Add an
<arcgis-charts-action-bar>component that will allow more interaction actions with the chart. - Explore interactive functionalities, such as filtering by extent of the map, synchronizing selections between the chart and the map and exporting the chart as an image or table for further analysis.
Prerequisites
- The most recent LTS Node.js runtime environment.
- A text editor to edit files.
- A terminal to enter commands.
Steps
Create a new project using Vite
-
Download
the initial Vite vanilla JavaScript project to your local machine. - Unzip the downloaded file.
- Open the unzipped folder’s files in your text editor.
- Navigate to the unzipped folder in your terminal.
Install dependencies
-
To use charts and map components, install the
@arcgis/charts-componentsand@arcgis/map-componentspackages and its dependencies into your project:npm install @arcgis/charts-components @arcgis/map-components @arcgis/core @esri/calcite-componentsyarn add @arcgis/charts-components @arcgis/map-components @arcgis/core @esri/calcite-components -
Start the Vite development server.
npm run devyarn run dev -
Open a web browser and navigate to http://localhost:5173, this webpage will be empty, however, it will update as we proceed through the remaining steps.
-
Import the stylesheet, along with the
<arcgis-chart>and the<arcgis-charts-action-bar>components from the@arcgis/charts-componentspackage inmain.js.main.jsimport "./style.css";import "@arcgis/charts-components/components/arcgis-chart";import "@arcgis/charts-components/components/arcgis-charts-action-bar"; -
Import the
<arcgis-map>component from the@arcgis/map-componentspackage inmain.js.main.jsimport "./style.css";import "@arcgis/charts-components/components/arcgis-chart";import "@arcgis/charts-components/components/arcgis-charts-action-bar";import "@arcgis/map-components/components/arcgis-map";
Add styles
-
Add CSS styles to make
htmlandbodyfill the entire viewport with no margin.style.csshtml,body {height: 100%;margin: 0;} -
Add CSS to the
arcgis-chartelement with a width of1200px.style.csshtml,body {height: 100%;margin: 0;}arcgis-chart {width: 1200px;}
Add components
-
Add the
<arcgis-map>component toindex.htmlunder<body>and set itsitem-idattribute to a WebMap portal item ID.index.html10 collapsed lines<!doctype html><html lang="en"><head><meta charset="UTF-8" /><link rel="icon" href="data:;base64,=" /><meta name="viewport" content="width=device-width, initial-scale=1, shrink-to-fit=no" /><title>ArcGIS Maps SDK for JavaScript Tutorials: Chart and Map Interactions</title></head><body><arcgis-map item-id="f2481ef191924872be8897179f73d55c"></arcgis-map><script type="module" src="main.js"></script></body>2 collapsed lines</html> -
Next, add the
<arcgis-chart>component to thebottom-rightslot of the map.index.html10 collapsed lines<!doctype html><html lang="en"><head><meta charset="UTF-8" /><link rel="icon" href="data:;base64,=" /><meta name="viewport" content="width=device-width, initial-scale=1, shrink-to-fit=no" /><title>ArcGIS Maps SDK for JavaScript Tutorials: Chart and Map Interactions</title></head><body><arcgis-map item-id="f2481ef191924872be8897179f73d55c"><arcgis-chart slot="bottom-right"></arcgis-chart></arcgis-map><script type="module" src="main.js"></script></body>2 collapsed lines</html> -
Lastly, add the
<arcgis-charts-action-bar>component to theaction-barslot of the chart component.The action bar provides built-in actions such as toggling legend visbility, rotation, filtering by selection, exporting as images or tables and more.
index.html10 collapsed lines<!doctype html><html lang="en"><head><meta charset="UTF-8" /><link rel="icon" href="data:;base64,=" /><meta name="viewport" content="width=device-width, initial-scale=1, shrink-to-fit=no" /><title>ArcGIS Maps SDK for JavaScript Tutorials: Chart and Map Interactions</title></head><body><arcgis-map item-id="f2481ef191924872be8897179f73d55c"><arcgis-chart slot="bottom-right"><arcgis-charts-action-bar slot="action-bar"></arcgis-charts-action-bar></arcgis-chart></arcgis-map><script type="module" src="main.js"></script></body>2 collapsed lines</html>
Interacting with the chart and map
-
In
main.js, usedocument.querySelector()to get references for the<arcgis-map>and<arcgis-chart>components.main.js6 collapsed linesimport "./style.css";import "@arcgis/charts-components/components/arcgis-chart";import "@arcgis/charts-components/components/arcgis-charts-action-bar";import "@arcgis/map-components/components/arcgis-map";const viewElement = document.querySelector("arcgis-map");const chartElement = document.querySelector("arcgis-chart"); -
Next, call the
viewOnReady()lifecycle method on the map element to wait for when the map’s view is ready.main.js9 collapsed linesimport "./style.css";import "@arcgis/charts-components/components/arcgis-chart";import "@arcgis/charts-components/components/arcgis-charts-action-bar";import "@arcgis/map-components/components/arcgis-map";const viewElement = document.querySelector("arcgis-map");const chartElement = document.querySelector("arcgis-chart");await viewElement.viewOnReady(); -
Once the map’s view is ready, we can get the
viewand the layer from theviewElementby providing the layer’s title.By calling the
load()method on the layer, we can ensure the layer is loaded before we set it on the chart.main.js9 collapsed linesimport "./style.css";import "@arcgis/charts-components/components/arcgis-chart";import "@arcgis/charts-components/components/arcgis-charts-action-bar";import "@arcgis/map-components/components/arcgis-map";const viewElement = document.querySelector("arcgis-map");const chartElement = document.querySelector("arcgis-chart");await viewElement.viewOnReady();const view = viewElement.view;const layer = viewElement.map?.layers.find((layer) => {return layer.title === "CollegeScorecard";});await layer.load(); -
To load the chart, set the chart’s
modelproperty to the layer’s first chart and thelayerproperty to the layer itself.main.js9 collapsed linesimport "./style.css";import "@arcgis/charts-components/components/arcgis-chart";import "@arcgis/charts-components/components/arcgis-charts-action-bar";import "@arcgis/map-components/components/arcgis-map";const viewElement = document.querySelector("arcgis-map");const chartElement = document.querySelector("arcgis-chart");await viewElement.viewOnReady();const view = viewElement.view;const layer = viewElement.map?.layers.find((layer) => {return layer.title === "CollegeScorecard";});await layer.load();chartElement.model = layer.charts[0];chartElement.layer = layer; -
Now that both the chart and the map are loaded, we can set up interactions between them. First we’ll set up the chart’s extent to the map’s, so when the map is panned or zoomed, the chart will only show features within the current map extent.
Set the chart’s
viewproperty to the map’s view. To use this feature, click on theFilter by extentaction in the chart’s action bar.main.js9 collapsed linesimport "./style.css";import "@arcgis/charts-components/components/arcgis-chart";import "@arcgis/charts-components/components/arcgis-charts-action-bar";import "@arcgis/map-components/components/arcgis-map";const viewElement = document.querySelector("arcgis-map");const chartElement = document.querySelector("arcgis-chart");await viewElement.viewOnReady();const view = viewElement.view;const layer = viewElement.map?.layers.find((layer) => {return layer.title === "CollegeScorecard";});await layer.load();chartElement.model = layer.charts[0];chartElement.layer = layer;chartElement.view = view; -
To show selected series from the chart on the map, set the chart’s
syncSelectionsBetweenChartAndLayerViewPolicyproperty to"enabled".When this property is enabled, the chart will be listening to the view’s
selectionManagerproperty.main.js9 collapsed linesimport "./style.css";import "@arcgis/charts-components/components/arcgis-chart";import "@arcgis/charts-components/components/arcgis-charts-action-bar";import "@arcgis/map-components/components/arcgis-map";const viewElement = document.querySelector("arcgis-map");const chartElement = document.querySelector("arcgis-chart");await viewElement.viewOnReady();const view = viewElement.view;const layer = viewElement.map?.layers.find((layer) => {return layer.title === "CollegeScorecard";});await layer.load();chartElement.model = layer.charts[0];chartElement.layer = layer;chartElement.view = view;chartElement.syncSelectionsBetweenChartAndLayerViewPolicy = "enabled"; -
To show selected features from the map on the chart, add an event listener for the
arcgisViewClickevent on the map element.In the event handler, use the view element’s
hitTest()method to get the clicked features and then use the view’sselectionManagerproperty to select those features on the map layer.main.js9 collapsed linesimport "./style.css";import "@arcgis/charts-components/components/arcgis-chart";import "@arcgis/charts-components/components/arcgis-charts-action-bar";import "@arcgis/map-components/components/arcgis-map";const viewElement = document.querySelector("arcgis-map");const chartElement = document.querySelector("arcgis-chart");await viewElement.viewOnReady();const view = viewElement.view;const layer = viewElement.map?.layers.find((layer) => {return layer.title === "CollegeScorecard";});await layer.load();chartElement.model = layer.charts[0];chartElement.layer = layer;chartElement.view = view;chartElement.syncSelectionsBetweenChartAndLayerViewPolicy = "enabled";viewElement.addEventListener("arcgisViewClick", async (event) => {const { results } = await viewElement.hitTest(event.detail, { include: [layer] });if (results?.length > 0) {const objectIds = results.map((r) => r.graphic.getObjectId());view.selectionManager.replace(layer, objectIds);}});
Run the application
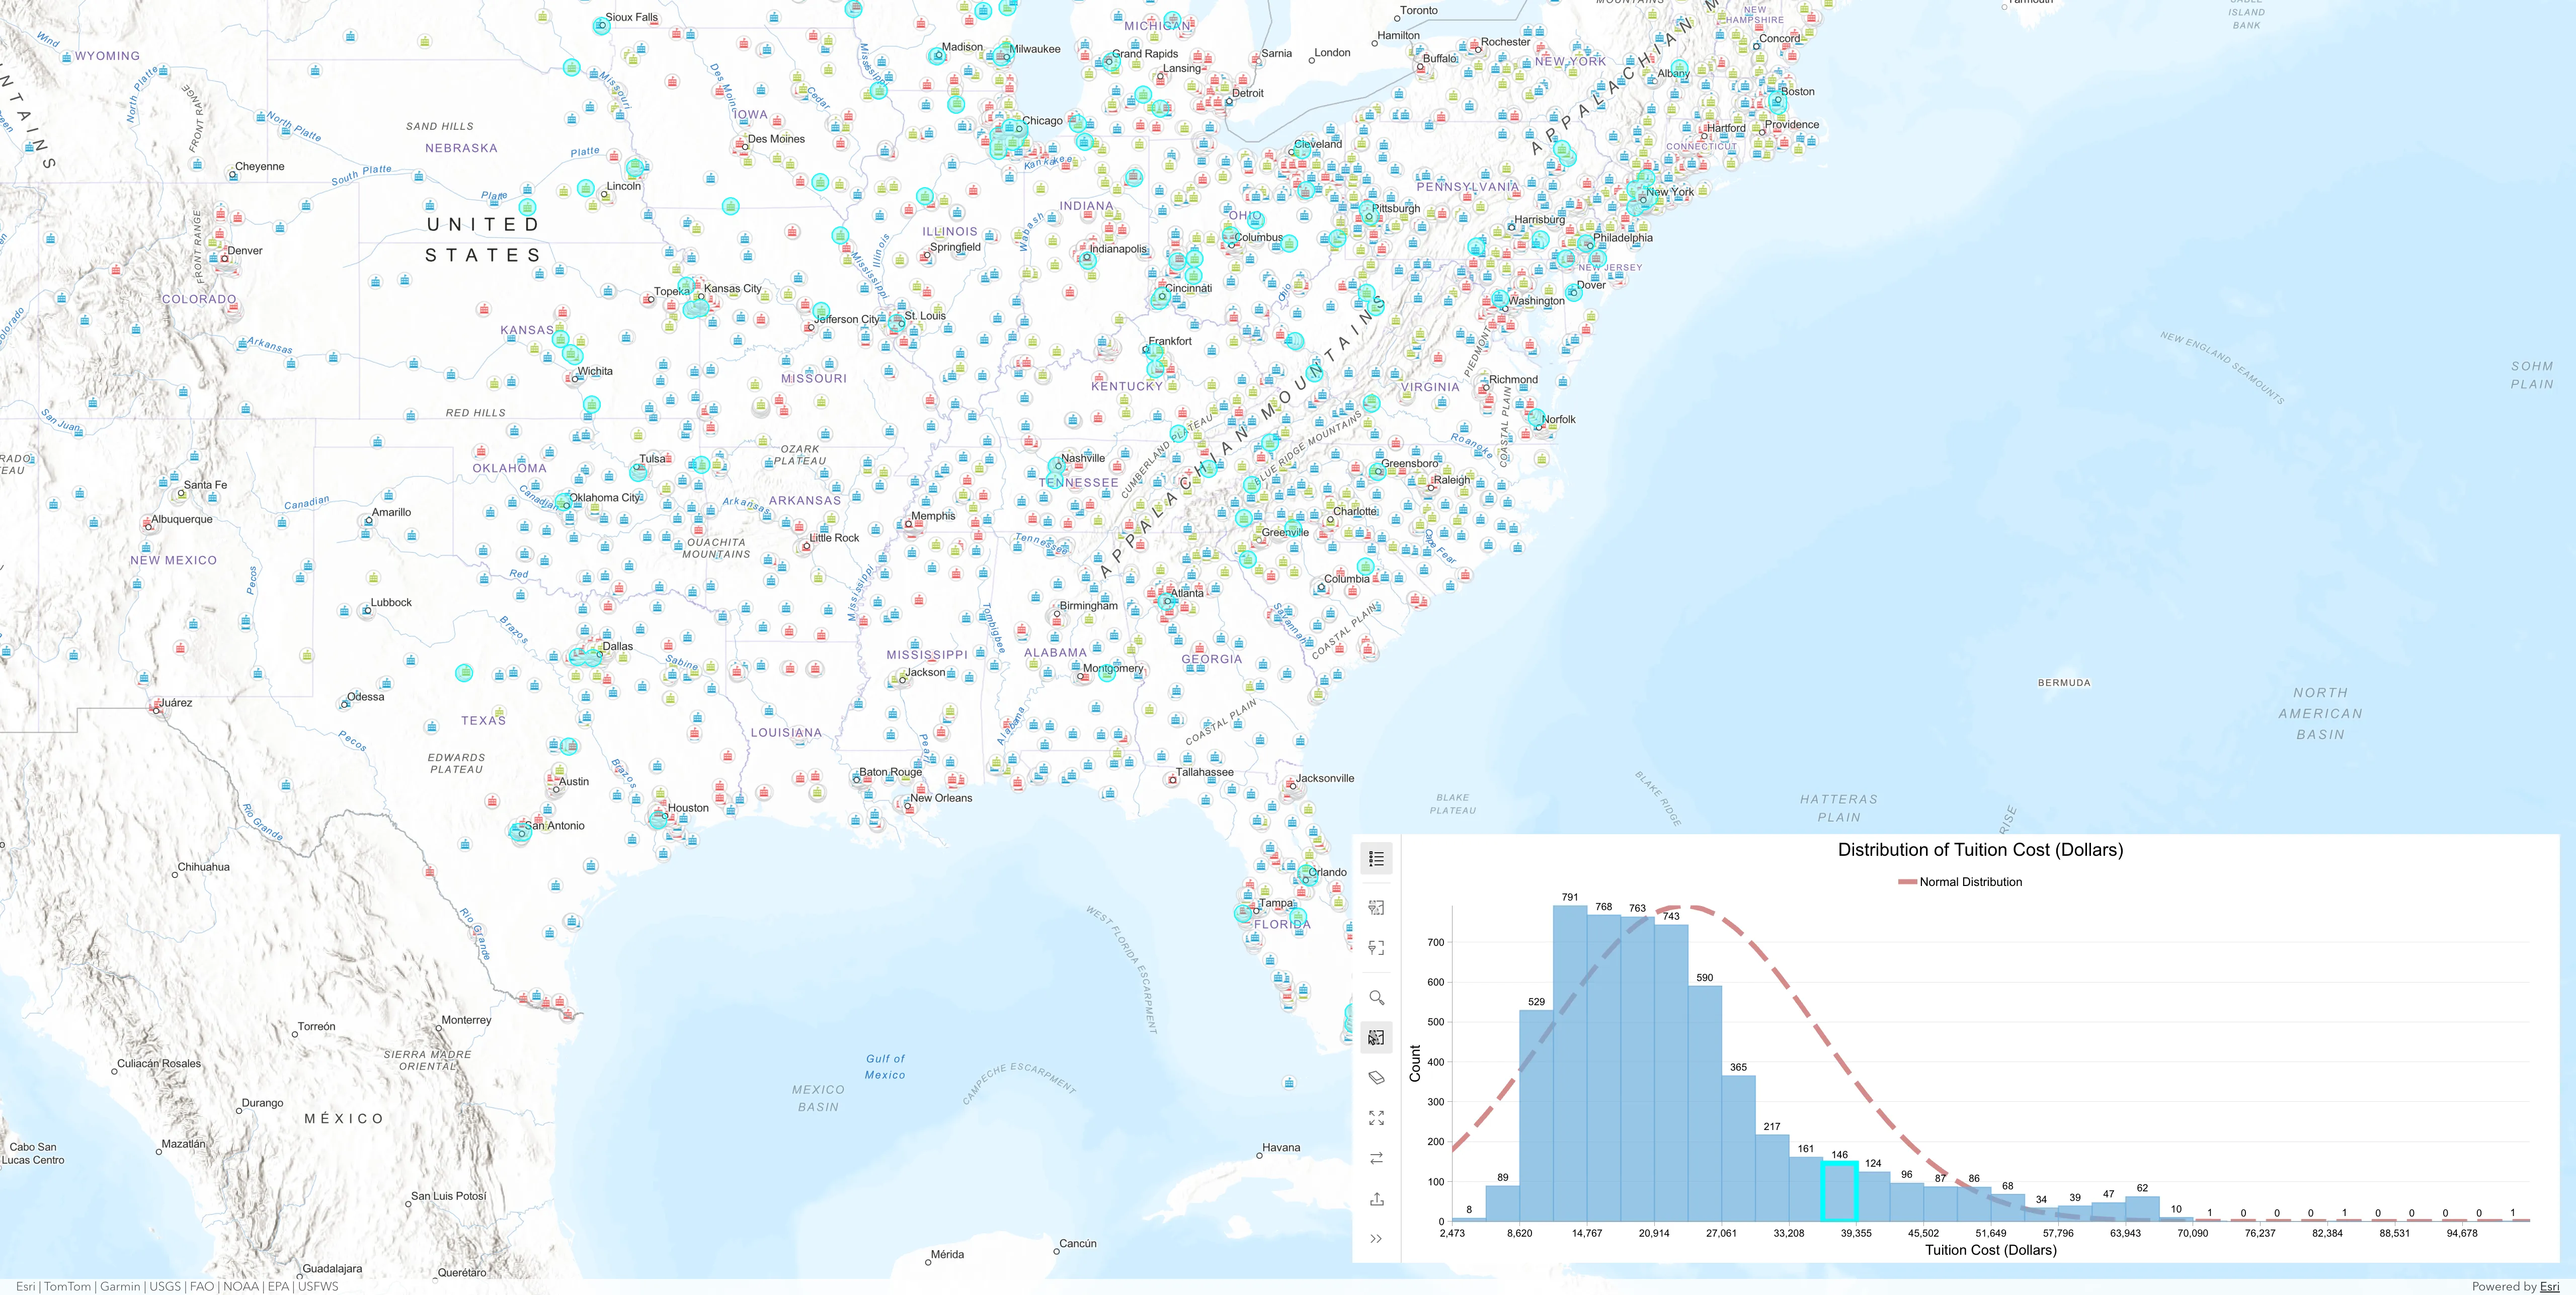
The application displays a chart in the bottom right corner of the map. Selecting features in the chart highlights the corresponding features on the map, and selecting features on the map highlights the corresponding features in the chart. When the Filter by extent action is enabled from the action bar, the chart updates to show only features within the current map extent.