import ClassBreaksRenderer from "@arcgis/core/renderers/ClassBreaksRenderer.js";const ClassBreaksRenderer = await $arcgis.import("@arcgis/core/renderers/ClassBreaksRenderer.js");- Since
- ArcGIS Maps SDK for JavaScript 4.0
ClassBreaksRenderer defines the symbol of each feature in a Layer based on the value of a numeric attribute. Symbols are assigned based on classes or ranges of data. Each feature is assigned a symbol based on the class break in which the value of the attribute falls.
Supported layers
ClassBreaksRenderer may only be used to create visualizations for the following layer types: FeatureLayer, SceneLayer, MapImageLayer, CSVLayer, GeoJSONLayer, OGCFeatureLayer, WFSLayer, StreamLayer, ImageryLayer, and ImageryTileLayer
A numeric attribute field from which to define the class breaks must be specified. Each break and its associated symbol must also be defined using the addClassBreakInfo() method or the classBreakInfos property in the constructor.
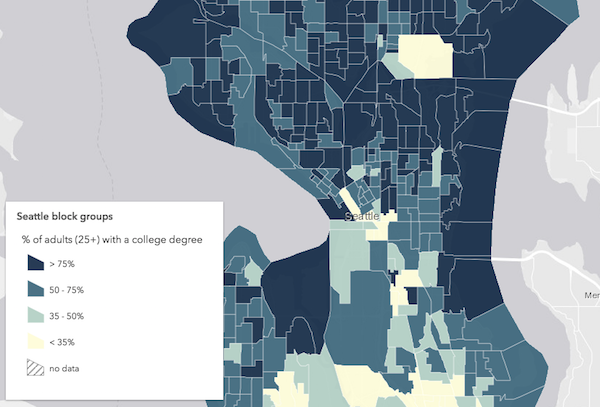
In the example below a FeatureLayer representing block groups is rendered with a ClassBreaksRenderer. Features where fewer than 35% of the population have a college degree are rendered with a deep green color. Features where between 35% and 50% of the population have a college degree are rendered with a pale green symbol. The other features are similarly rendered based on the value of the attribute of interest.
Example
let renderer = new ClassBreaksRenderer({  // attribute of interest - Earthquake magnitude  field: "MAGNITUDE"});// All features with magnitude between 0 - 4.0renderer.addClassBreakInfo({  minValue: 0,  maxValue: 4.0,  symbol: {    type: "point-3d",  // autocasts as new PointSymbol3D()    symbolLayers: [{      type: "object",  // autocasts as new ObjectSymbol3DLayer()      resource: { primitive: "cone" },      material: { color: [0, 169, 230] },      height: 200000,      width: 50000    }]  }});// All features with magnitude between 4.1 - 7.0renderer.addClassBreakInfo({  minValue: 4.1,  maxValue: 7.0,  symbol: {    type: "point-3d",  // autocasts as new PointSymbol3D()    symbolLayers: [{      type: "object",  // autocasts as new ObjectSymbol3DLayer()      resource: { primitive: "cone" },      material: { color: [230, 230, 0] },      height: 800000,      width: 90000    }]  }});// All features with magnitude between 7.1 - 10.0renderer.addClassBreakInfo({  minValue: 7.1,  maxValue: 10.0,  symbol: {    type: "point-3d",  // autocasts as new PointSymbol3D()    symbolLayers: [{      type: "object",  // autocasts as new ObjectSymbol3DLayer()      resource: { primitive: "cone" },      material: { color: [230, 0, 0] },      height: 3200000,      width: 130000    }]  }});
let layer = new FeatureLayer({  url: "http://url.to.service",  renderer: renderer});
Constructors
Constructor
Parameters
| Parameter | Type | Description | Required |
|---|---|---|---|
| properties | | |
Example
// Typical usagelet renderer = { type: "class-breaks", // autocasts as new ClassBreaksRenderer() field: "fieldName", classBreakInfos: [ ... ]};Properties
| Property | Type | Class |
|---|---|---|
authoringInfo inherited | ||
| | ||
| | ||
declaredClass readonly inherited | ||
| | ||
SymbolUnion | null | undefined | | |
| | ||
| | ||
| | ||
| | ||
| | ||
type readonly | "class-breaks" | |
| | ||
| | ||
visualVariables inherited | VisualVariable[] | null | undefined |
authoringInfo
- Type
- AuthoringInfo | null | undefined
Authoring metadata only included in renderers generated from one of the Smart Mapping creator methods, such as sizeRendererCreator.createContinuousRenderer() or colorRendererCreator.createContinuousRenderer(). This includes information from UI elements such as sliders and selected classification methods and themes. This allows the authoring clients to save specific overridable settings so that next time it is accessed via the UI, their selections can be remembered.
backgroundFillSymbol
- Type
- FillSymbolUnion | PolygonSymbol3D | CIMSymbol | null | undefined
When symbolizing polygon features with graduated symbols, set a FillSymbol on this property to visualize the boundaries of each feature. Use a FillSymbol of varying sizes in the classBreakInfos to indicate the quantity.
Support for CIMSymbol was added at version 4.31 and is limited to 2D MapView.
Example
// this symbol will be applied to all features. It is only// necessary when visualizing polygon data with icons.renderer.backgroundFillSymbol = { type: "simple-fill", outline: { width: 1, color: "gray" }}; classBreakInfos
- Type
- ClassBreakInfo[]
Each element in the array is an object that provides information about a class break associated with the renderer.
Example
let renderer = { type: "class-breaks", // autocasts as new ClassBreaksRenderer() field: "HARVESTED_ACRES", classBreakInfos: [ { minValue: 0, // 0 acres maxValue: 200000, // 200,000 acres symbol: sym1, // will be assigned sym1 label: "fewer than 200,000 acres" }, { minValue: 200001, // 200,001 acres maxValue: 500000, // 500,000 acres symbol: sym2, // will be assigned sym2 label: "200,000 - 500,000 acres" }, { minValue: 500001, // 500,001 acres maxValue: 750000, // 750,000 acres symbol: sym3, // will be assigned sym2 label: "more than 500,000 acres" } ]}; defaultLabel
Label used in the Legend to describe features assigned the default symbol. The default symbol is used to draw all features with unspecified, unmatched values.
defaultSymbol
- Type
- SymbolUnion | null | undefined
The default symbol assigned to features with a value not matched to a given break.
If null, unmatched features will not be assigned a symbol.
Known Limitations
SceneLayers with a mesh SceneLayer.geometryType
will display unmatching features with a generic symbol even if the defaultSymbol is
null.
field
- Type
- string
The name of a numeric attribute field whose data determines the symbol of each feature based on the class breaks defined in classBreakInfos.
Example
let renderer = { type: "class-breaks", // autocasts as new ClassBreaksRenderer() field: "totalAcres", // values returned by this field will // be used to render features classBreakInfos: [ { minValue: 0, // 0 acres maxValue: 200000, // 200,000 acres symbol: sym1 // will be assigned sym1 }, { minValue: 200001, // 200,001 acres maxValue: 500000, // 500,000 acres symbol: sym2 // will be assigned sym2 }, { minValue: 500001, // 500,001 acres maxValue: 750000, // 750,000 acres symbol: sym3 // will be assigned sym2 } ]}; legendOptions
- Type
- RendererLegendOptions | null | undefined
An object providing options for displaying the renderer in the Legend.
Example
renderer.legendOptions = { title: "Population density", order: "descending-values",}; normalizationField
When normalizationType is field, this property contains the
attribute field name used for normalization.
normalizationTotal
When normalizationType is percent-of-total, this property
contains the total of all data values.
normalizationType
Indicates how the data is normalized. If this property is defined, then the class breaks contain a normalized min/max value instead of the value in the given field. The data value obtained from the field is normalized in one of the following ways before it is compared with the class breaks. See the table below for a list of possible values.
| Possible Value | Description |
|---|---|
| field | Divides the data value using the attribute value of the field specified in the normalizationField property. This value is set by default if the normalizationField is provided. |
| log | Computes the base 10 logarithm of the data value. This can be a useful approach for some data distributions because it reduces the influence of very large data values. |
| percent-of-total | Divides the data value by the sum of all data values then multiplies by 100. Use normalizationTotal to define the total value by which to normalize. This value is set by default if the normalizationTotal is provided. |
With the exception of log normalization, data normalization creates a ratio by dividing two values.
When comparing attribute values between features, normalization minimizes the effect of varying
map areas and the number of observations.
For example, dividing the 18 to 30 year old population by the area of a polygon feature yields a density value that can be compared evenly with other features, regardless of their size.
valueExpression
An Arcade expression following the specification
defined by the Arcade Visualization Profile. Expressions
in ClassBreaksRenderer may reference field values using the $feature profile variable and must return a number.
The values returned from this expression are the data used to drive the visualization as defined in the classBreakInfos.
This property is typically used as an alternative to field for data-driven visualizations.
- See also
Example
// expression calculating voter turnout based on two field valueslet renderer = { type: "class-breaks", // autocasts as new ClassBreaksRenderer() valueExpression: "( $feature.TOT_VOTES / $feature.REG_VOTERS ) * 100", classBreakInfos: [ ... ], // assigns symbols to manual class breaks // e.g. 0-20, 20-40, 40-60, 60-80, 80-100}; valueExpressionTitle
The title identifying and describing the associated Arcade
expression as defined in the valueExpression property. This is displayed
as the title of the corresponding renderer in the Legend
in the absence of a provided title in the legendOptions property.
Example
renderer.valueExpression = "$feature.POP / $feature.SQ_MI * 100";renderer.valueExpressionTitle = "Population per square mile"; visualVariables
- Type
- VisualVariable[] | null | undefined
An array of VisualVariable objects. Each object must indicate the type of visual variable to apply (e.g. ColorVisualVariable, SizeVisualVariable, OpacityVisualVariable, RotationVisualVariable), the numeric field or expression from which to drive the visualization, and the visual values to map to the data. The following list identifies each visual variable type and provides a link to the specification table of each.
| Type | Object Specification | Legend Example |
|---|---|---|
| color | ColorVisualVariable |  |
| size | SizeVisualVariable | 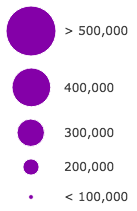 |
| opacity | OpacityVisualVariable |  |
| rotation | RotationVisualVariable | - |
Visual variables are primarily be used in two ways.
1. Thematic mapping
In most cases, visual variables are used to create visualizations based on a thematic attribute (e.g. population, education, rank, money, magnitude, etc.) in either 2D or 3D.
renderer.visualVariables = [{ type: "size", field: "POP_POVERTY", normalizationField: "TOTPOP_CY", legendOptions: { title: "% population in poverty by county" }, stops: [ { value: 0.15, size: 4, label: "<15%" }, { value: 0.25, size: 12, label: "25%" }, { value: 0.35, size: 24, label: ">35%" } ]}];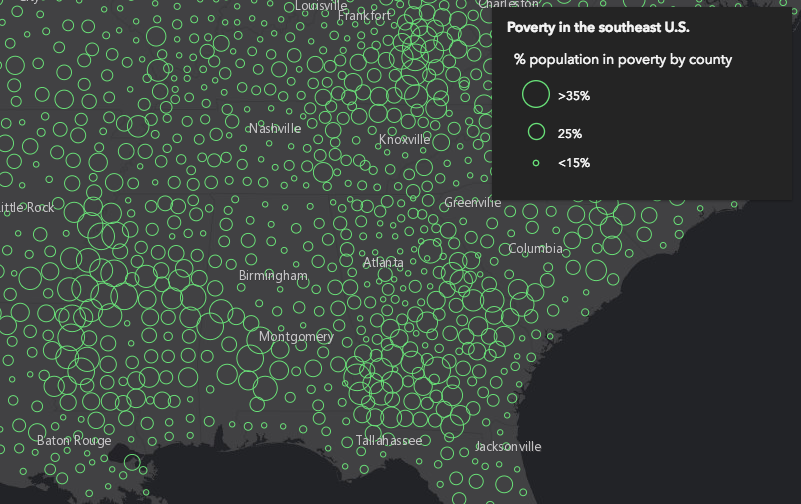
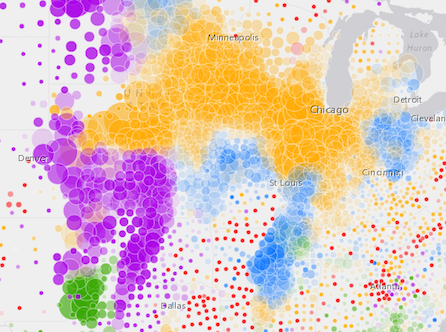
You can take the visualization a step further and use multiple visual variables in the same renderer. The sample below uses three visual variables (size, color, and opacity).
2. Mapping real-world sizes
The size visual variable can be used to visualize the true sizes of features (e.g. tree canopy, road width, building height, etc.) based on their size in the real world. This can be particularly powerful when working in a 3D SceneView. The image below shows a layer of trees that uses visual variables to size each feature to the true dimensions of each tree based on data stored in multiple attribute fields.
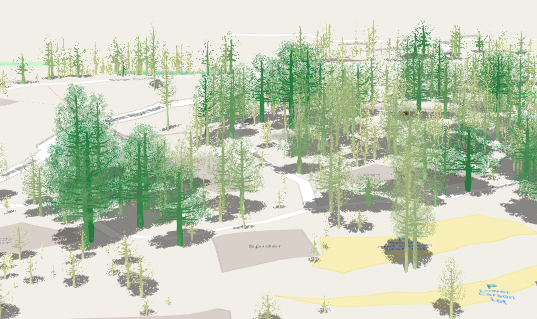
See the Thematic visualization with realistic 3D symbols for an example of using multiple visual variables to visualize your data.
Known Limitations
Color and opacity visual variables must not have more than 8 stops and size visual variables must not have more than 6 stops. This does not apply to variables driven by view scale.
For apps where users can interactively change the field or valueExpression of a visual variable, we suggest
you include all potential fields referenced by visual variables in the FeatureLayer.outFields
of the layer. This ensures the best user experience when switching or updating fields in renderers.
- See also
Methods
| Method | Signature | Class |
|---|---|---|
fromJSON inherited static | fromJSON(json: any): any | |
addClassBreakInfo(min: number | ClassBreakInfoProperties, max?: number, symbol?: SymbolUnion): void | | |
clone(): ClassBreaksRenderer | | |
getClassBreakInfo(graphic: Graphic): Promise<ClassBreakInfo | null | undefined> | | |
removeClassBreakInfo(min: number, max: number): void | | |
toJSON inherited | toJSON(): any |
fromJSON
- Signature
-
fromJSON (json: any): any
Creates a new instance of this class and initializes it with values from a JSON object
generated from an ArcGIS product. The object passed into the input json
parameter often comes from a response to a query operation in the REST API or a
toJSON()
method from another ArcGIS product. See the Using fromJSON()
topic in the Guide for details and examples of when and how to use this function.
Parameters
| Parameter | Type | Description | Required |
|---|---|---|---|
| json | A JSON representation of the instance in the ArcGIS format. See the ArcGIS REST API documentation for examples of the structure of various input JSON objects. | |
- Returns
- any
Returns a new instance of this class.
addClassBreakInfo
- Signature
-
addClassBreakInfo (min: number | ClassBreakInfoProperties, max?: number, symbol?: SymbolUnion): void
Adds a class break to the renderer. You can provide the minimum, maximum and symbol values as individual arguments or by using the info object. The range of the break is greater than or equal to the minimum value and less than the maximum value.
Parameters
| Parameter | Type | Description | Required |
|---|---|---|---|
| min | The minimum value to use in the break. This can be a number or an info object as defined in classBreakInfos. | | |
| max | The maximum value to use in the break. | | |
| symbol | Symbol to use for the break. | |
- Returns
- void
Examples
// add a class break using an info objectrenderer.addClassBreakInfo({ minValue: 0, // lower limit of the break maxValue: 2, // upper limit of the break symbol: symbol1 // the symbol assigned to features in this break});// add a class break using argumentsrenderer.addClassBreakInfo(2, 4, symbol2);// Features with values between 2 - 4 will be assigned symbol2}); clone
- Signature
-
clone (): ClassBreaksRenderer
Creates a deep clone of the renderer.
- Returns
- ClassBreaksRenderer
A deep clone of the object that invoked this method.
Example
// Creates a deep clone of the first layer's rendererlet renderer = view.map.layers.at(0).renderer.clone(); getClassBreakInfo
- Signature
-
getClassBreakInfo (graphic: Graphic): Promise<ClassBreakInfo | null | undefined>
Returns the classBreakInfo information (as defined by the renderer) associated with the given graphic.
Parameters
| Parameter | Type | Description | Required |
|---|---|---|---|
| graphic | The graphic whose rendering information will be returned. | |
- Returns
- Promise<ClassBreakInfo | null | undefined>
Resolves to an object containing rendering and legend information for the break associated with the graphic.
Example
view.on("click", function(event){ view.hitTest(event) .then(function(hitResponse){ const resultGraphic = hitResponse.results[0].graphic; // assumes the layer's renderer is a ClassBreakRenderer instance return layer.renderer.getClassBreakInfo(resultGraphic); }).then(function(classBreak){ // returns the class break info to which the graphic belongs. });}); removeClassBreakInfo
- Signature
-
removeClassBreakInfo (min: number, max: number): void
Removes a break from the renderer.
Parameters
- Returns
- void
Example
// removes the break defined for values between 2 - 4.renderer.removeClassBreakInfo(2,4); toJSON
- Signature
-
toJSON (): any
Converts an instance of this class to its ArcGIS portal JSON representation. See the Using fromJSON() guide topic for more information.
- Returns
- any
The ArcGIS portal JSON representation of an instance of this class.