import { updateRenderer, createRenderer } from "@arcgis/core/smartMapping/renderers/relationship.js";const { updateRenderer, createRenderer } = await $arcgis.import("@arcgis/core/smartMapping/renderers/relationship.js");- Since
- ArcGIS Maps SDK for JavaScript 4.9
This object contains a helper method for creating a renderer for exploring the relationship between two numeric attributes. This is commonly known as a bivariate choropleth visualization. This renderer classifies each variable in either 2, 3, or 4 classes along separate color ramps. One of those ramps is rotated 90 degrees and overlaid on the other to create a 2x2, 3x3, or 4x4 square grid. The x-axis indicates the range of values for one variable, and the y-axis indicates the range for the second variable. The squares running diagonal from the lower left corner to the upper right corner indicate features where the two variables may be related or in agreement with one another.
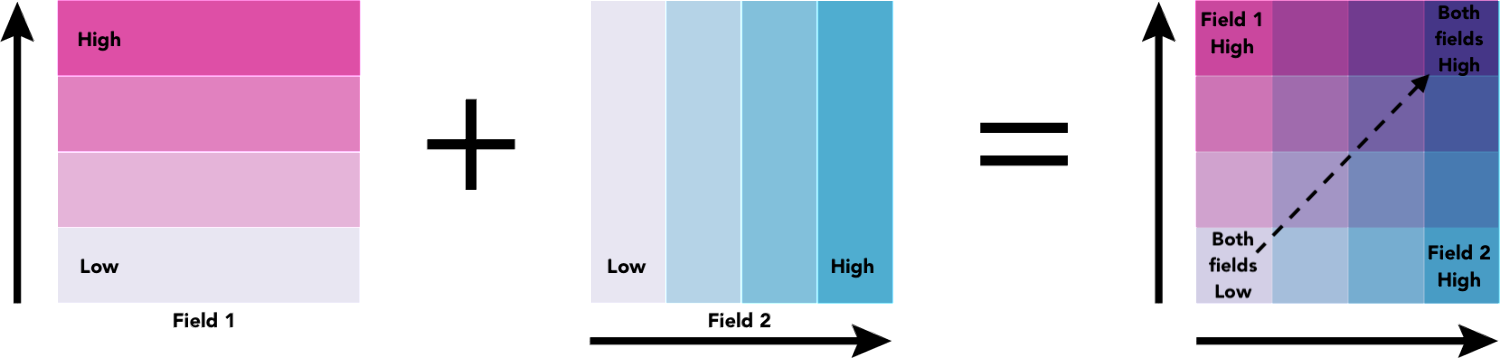
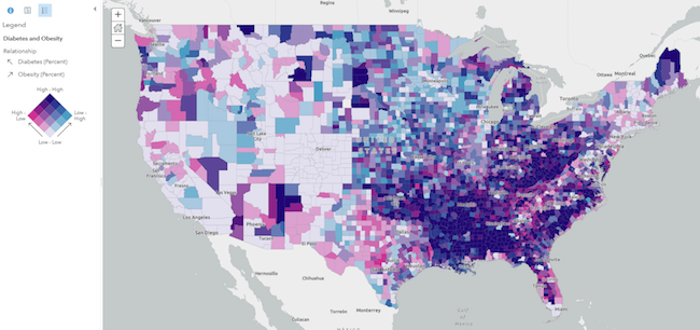
The lower right and upper left corners indicate features where one field has high values and the other field low values and vice versa. The image below shows what this style looks like on a map of U.S. counties where the percent of the population diagnosed with Diabetes is compared to the percent of the population that is obese.
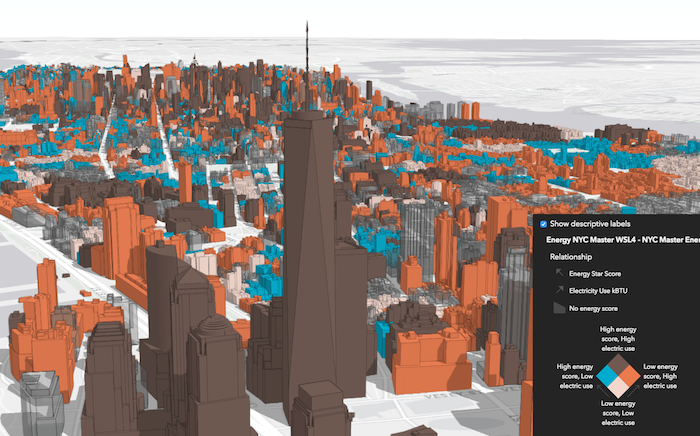
While this visualization style was originally designed for 2D choropleth maps, it is particularly useful in 3D scenes where bivariate visualizations of color and size would not otherwise be possible since the size of features is reserved for real-world sizes of objects, such as buildings. Therefore, the relationship renderer becomes ideal for creating thematic bivariate visualizations of 3d object SceneLayers.
Keep in mind that even if you observe a positive relationship between the two variables of interest, it doesn't mean they are statistically correlated. It also doesn't imply the presence of one variable influences the other. Therefore, this renderer should be used judiciously with some prior knowledge that two variables may likely be related.
Known Limitations
SceneLayers must have the supportsRenderer and supportsLayerQuery capabilities enabled unless a predefined statistics object is provided to the statistics parameter of the method. To check a SceneLayer's capabilities, use the SceneLayer.getFieldUsageInfo() method.
Functions
updateRenderer
Updates a relationship renderer (bivariate choropleth) generated from createRenderer() based on the given input parameters.
- Signature
-
updateRenderer (parameters: UpdateRendererParameters): Promise<UniqueValueRenderer>
Parameters
| Parameter | Type | Description | Required |
|---|---|---|---|
| parameters | Input parameters for updating a relationship visualization created in createRenderer(). | |
- Returns
- Promise<UniqueValueRenderer>
Resolves to the updated relationship renderer.
createRenderer
Generates a relationship renderer (bivariate choropleth) based on a set of competing numeric fields.
Each feature's category is determined based on the result of an Arcade expression generated internally
by this method. You are required provide a layer, view, field1 name, and field2 name to generate this renderer. Optionally, you can
set the focus to change the rotation of the legend and the numClasses parameter to change the grid size of the legend.
Other options are provided for convenience for more involved custom visualization authoring applications.
- Signature
-
createRenderer (parameters: RendererParameters): Promise<RendererResult>
Parameters
| Parameter | Type | Description | Required |
|---|---|---|---|
| parameters | Input parameters for generating a relationship visualization based on a pair of numeric field(s). | |
- Returns
- Promise<RendererResult>
Resolves to an instance of RendererResult.
Example
const layer = new FeatureLayer({  url: "https://services.arcgis.com/..."});
// will create a bivariate choropleth visualization exploring the relationship// between the % of the population classified as obese, and the %// of the population diagnosed with diabetes
const parameters = {  layer: layer,  view: view,  field1: {    field: "POP_Diabetes",    normalizationField: "TOTAL_POP"  },  field2: {    field: "POP_Obesity",    normalizationField: "TOTAL_POP"  },  focus: "HH",  defaultSymbolEnabled: false};
// when the promise resolves, apply the renderer to the layerrelationshipRendererCreator.createRenderer(parameters)  .then(function(response){    layer.renderer = response.renderer;  });
Type definitions
RendererParameters
- Supertypes
- AbortOptions
layer
- Type
- FeatureLikeLayerOrAdapter | null | undefined
The layer for which the visualization is generated. When a client-side layer type is provided, attribute and spatial statistics are calculated only from features in the view's extent. When a server-side layer type is provided, the statistics are calculated from the entire layer.
classificationMethod
- Type
- "equal-interval" | "natural-breaks" | "quantile" | undefined
The method for classifying each field's data values. See classBreaks() for more information about each classification type.
- Default value
- quantile
focus
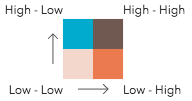
Determines the orientation of the Legend. This value does not change the renderer or symbology of any features in the layer. This affects the legend only. See the table below for a description of the possible values. See the class description at the top of this page for a more thorough explanation of how to read the legend.
| Value | Example | Description |
|---|---|---|
| null |  | The legend renders as a square. The top right corner of the legend indicates that values from both field1 and field2 are considered high. |
| HH | 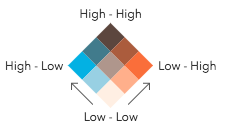 | The legend renders as a diamond with the focus on the top corner where values from both field1 and field2 are considered high. |
| HL | 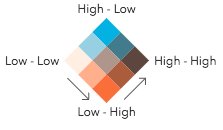 | The legend renders as a diamond with the focus on the top corner where values from field1 are high and values from field2 are low. |
| LH | 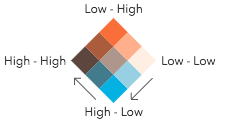 | The legend renders as a diamond with the focus on the top corner where values from field1 are low and values from field2 are high. |
| LL | 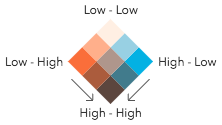 | The legend renders as a diamond with the focus on the top corner where values from both field1 and field2 are considered low. |
- Default value
- null
numClasses
- Type
- RelationshipNumClasses | null | undefined
Indicates the number of classes by which to break up the values of each field. More classes give you more detail, but more colors, making the visualization more difficult to understand. There are only three possible values.
| 2 classes | 3 classes | 4 classes |
|---|---|---|
 | 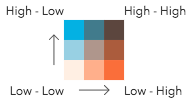 | 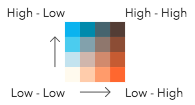 |
Possible Values: 2 | 3 | 4
- Default value
- 3
legendOptions
- Type
- RendererLegendOptionsProperties | null | undefined
Provides options for modifying Legend properties describing the visualization.
relationshipScheme
- Type
- RelationshipScheme | null | undefined
In authoring apps,
the user may select a pre-defined relationship scheme. Pass the scheme object to this property to avoid getting one based on the background of the view.
outlineOptimizationEnabled
For polygon layers only. Indicates whether the
polygon outline width should vary based on view scale. When set, a valid MapView
instance must be provided in the view parameter. This option is not supported for 3D
SceneViews.
- Default value
- false
sizeOptimizationEnabled
For point and polyline layers only. Indicates whether
symbol sizes should vary based on view scale. When set, a valid MapView
instance must be provided in the view parameter. This option is not supported for 3D
SceneViews.
- Default value
- false
forBinning
Indicates whether the generated renderer is for a binning or clustering visualization.
If true, then the input field(s) in this method should refer to aggregate fields defined in the featureReduction property of the layer.
filter
- Type
- FeatureFilter | null | undefined
- Since
- ArcGIS Maps SDK for JavaScript 4.31
When defined, only features included in the filter
are considered in the attribute and spatial statistics calculations when determining the final renderer.
This is useful when a lot of variation exists in the data
that could result in undesired data ranges. A common use case would be to set a filter that only
includes features in the current extent of the view where the data is most likely to be viewed. Currently, only
geometry filters with an intersects spatial relationship are supported. All other filter types (including where) are ignored.
symbolType
- Type
- SymbolType | null | undefined
The type of symbol to generate. This depends on the view
in which you are working and the desired visualization. This parameter does not need to be specified for layers
with a mesh geometry type. Possible values are described below.
| Value | Description |
|---|---|
| 2d | Generates a visualization using 2D symbols such as SimpleMarkerSymbol, SimpleLineSymbol, or SimpleFillSymbol. Use this option if generating a visualization for data in a MapView. |
| 3d-flat | Generates a visualization using 3D symbols with flat symbol layers such as IconSymbol3DLayer, LineSymbol3DLayer, or FillSymbol3DLayer. Use this option if generating a 2D visualization for data in a SceneView. |
| 3d-volumetric | Generates a visualization using 3D symbols with volumetric symbol layers such as ObjectSymbol3DLayer, PathSymbol3DLayer, or ExtrudeSymbol3DLayer. Use this option if generating a 3D visualization for data in a SceneView. A SceneView instance must be provided to the view parameter if this option is used. |
| 3d-volumetric-uniform | Generates a visualization using uniformly sized 3D symbols with volumetric symbol layers. Use this option if generating a 3D visualization for data in a SceneView and the symbol should be sizes uniformly, for example with spheres. A SceneView instance must be provided to the view parameter if this option is used. |
- Default value
- 2d
colorMixMode
- Type
- ColorMixModeType | null | undefined
This option only applies to generating renderers for mesh SceneLayers. Specifies how the symbol's color is applied to the geometry color/texture. See the documentation in FillSymbol3DLayer.material for more context. See the table below for possible values.
| Value | Description |
|---|---|
| tint | Applies the symbol color to the desaturated geometry/texture color. |
| replace | Removes the geometry/texture color and applies the symbol color. |
| multiply | Multiplies geometry/texture color value with the symbol color value. The result is a darker color. Multiplying with white keeps the geometry color the same. |
- Default value
- replace
view
- Type
- MapViewOrSceneView | null
The view instance in which the visualization will be rendered.
ClassBreaksInfo
field1
- Type
- ClassBreaksResult
The class breaks generated for values in the field1 parameter.
field2
- Type
- ClassBreaksResult
The class breaks generated for values in the field2 parameter.
RendererResult
The result object of the createRenderer() method. See the table below for details of each property.
renderer
- Type
- UniqueValueRenderer
The renderer object representing
the relationship visualization. Set this on a layer's renderer property to update its visualization.
classBreaks
- Type
- ClassBreaksInfo
Describes each class break for both fields considered in the relationship visualization.
uniqueValueInfos
- Type
- UniqueValueInfo[]
Describes each
container or bin used in the visualization. Each unique value info object describes a class break for field1
and field2. Therefore, features with the same color fall share will have values that fall in the same class break
for field1 and the same class break for field2.
basemapTheme
- Type
- BasemapTheme | null | undefined
Indicates whether the average color of the input view's basemap is light or dark.
UpdateParamsFieldInfo
classBreakInfos
- Type
- ClassBreak[]
The class breaks for the field used in the relationship visualization.
UpdateRendererParameters
field1
- Type
- UpdateParamsFieldInfo | null | undefined
A numeric field used to explore its relationship with field2. In the default visualization,
the values of this field are rendered along the vertical axis of the Legend.
field2
- Type
- UpdateParamsFieldInfo | null | undefined
A numeric field used to explore its relationship with field1. In the default visualization,
the values of this field are rendered along the horizontal axis of the Legend.
renderer
- Type
- UniqueValueRenderer | null | undefined
The relationship renderer (generated from createRenderer()) to update with the other parameters provided in this method.
numClasses
- Type
- RelationshipNumClasses | null | undefined
Indicates the number of classes by which to break up the values of each field. More classes give you more detail, but more colors, making the visualization more difficult to understand. There are only three possible values.
| 2 classes | 3 classes | 4 classes |
|---|---|---|
| | |
Possible Values: 2 | 3 | 4
focus
Determines the orientation of the Legend. This value does not change the renderer or symbology of any features in the layer. This affects the legend only. See the table below for a description of the possible values. See the class description at the top of this page for a more thorough explanation of how to read the legend.
| Value | Example | Description |
|---|---|---|
| null | | The legend renders as a square. The top right corner of the legend indicates that values from both field1 and field2 are considered high. |
| HH | | The legend renders as a diamond with the focus on the top corner where values from both field1 and field2 are considered high. |
| HL | | The legend renders as a diamond with the focus on the top corner where values from field1 are high and values from field2 are low. |
| LH | | The legend renders as a diamond with the focus on the top corner where values from field1 are low and values from field2 are high. |
| LL | | The legend renders as a diamond with the focus on the top corner where values from both field1 and field2 are considered low. |
- Default value
- null