Learn how to add a vector tile layer to a map.
A vector tile layer is a hosted data layer in ArcGIS. The data is vector tile data. You can create a vector tile layer by publishing your data with data management tools. To display vector tiles in MapLibre GL JS, you create a source to retrieve the tiles, and a layer to display them.
In this tutorial, you display a parcels layer from a public vector tile service, using the default styling.
Prerequisites
You need an ArcGIS Developer or ArcGIS Online account to access the developer dashboard and create an API key.
Steps
Review the source data
This tutorial uses the Santa Monica Mountains Parcels vector tile service. Go to the item page of the vector tile service in ArcGIS.com to find important styling information.
-
Go to the item page for the Santa Monica Mountains Parcels vector tile layer.
-
Click View style from the item details page.
-
Find the
source-layerproperty in the JSON file and copy the exact value. You will use this to style vector tiles in your MapLibre GL JS application.
Create a new pen
- To get started, either complete the Display a map tutorial or .
Set the API key
To access location services, you need an API key or OAuth 2.0 access token. To learn how to create and scope your key, visit the Create an API key tutorial.
-
Go to your dashboard to get an API key. The API key must be scoped to access the services used in this tutorial.
-
In CodePen, update
apito use your key.Key Use dark colors for code blocks const apiKey = "YOUR_API_KEY"; const basemapEnum = "arcgis/streets"; const map = new maplibregl.Map({ container: "map", // the id of the div element style: `https://basemapstyles-api.arcgis.com/arcgis/rest/services/styles/v2/styles/${basemapEnum}?token=${apiKey}`, zoom: 12, // starting zoom center: [-118.805, 34.027] // starting location [longitude, latitude] });
Add a load event handler
You need to wait for the map to be completely loaded before adding any layers
-
Add an event handler to the map
loadevent.For more information about the
loadevent, see the MapLibre GL JS documentation.Use dark colors for code blocks <script> const apiKey = "YOUR_API_KEY"; const basemapEnum = "arcgis/streets"; const map = new maplibregl.Map({ container: "map", // the id of the div element style: `https://basemapstyles-api.arcgis.com/arcgis/rest/services/styles/v2/styles/${basemapEnum}?token=${apiKey}`, zoom: 12, // starting zoom center: [-118.805, 34.027] // starting location [longitude, latitude] }); map.once("load", () => { // This code runs once the base style has finished loading. }); </script>
Add a vector tile source
You use a source of type vector to add the vector tiles. The source tells MapLibre GL JS how to access the data for the layer, but does not visually add it to the map.
-
Inside the load event handler, add a vector tile source with id
parcels.While there are several types of source, the two most common are
vector(for vector tiles) andgeojson(for a set of features represented as GeoJSON).For more information, see the MapLibre Style Specification
Use dark colors for code blocks map.once("load", () => { // This code runs once the base style has finished loading. map.addSource("parcels", { type: "vector", tiles: [ "https://vectortileservices3.arcgis.com/GVgbJbqm8hXASVYi/arcgis/rest/services/Santa_Monica_Mountains_Parcels_VTL/VectorTileServer/tile/{z}/{y}/{x}.pbf" ] }); });
Add a fill layer
A layer in MapLibre GL JS is a visual representation of the data within one source. Use a layer of type fill to display the parcels.
-
Use
addto add aLayer filllayer with idparcels-fill. Setsourcetoparcelsto reference the source you just created.The
typeproperty defines how it will be displayed. Commonly used layer types includecircle,line,fillandsymbol(used for text and icons).The
idproperty is an identifier you choose. You will need it if you want to manipulate the layer, such as hiding it or changing its properties dynamically.The
sourceproperty references theidproperty of the source you just created.Use dark colors for code blocks map.once("load", () => { // This code runs once the base style has finished loading. map.addSource("parcels", { type: "vector", tiles: [ "https://vectortileservices3.arcgis.com/GVgbJbqm8hXASVYi/arcgis/rest/services/Santa_Monica_Mountains_Parcels_VTL/VectorTileServer/tile/{z}/{y}/{x}.pbf" ] }); map.addLayer({ id: "parcels-fill", type: "fill", source: "parcels", }); -
Add a
source-layerattribute and paste theSanta_value that you copied from the layer's item page.Monica_ Mountains_ Parcels Use dark colors for code blocks map.once("load", () => { // This code runs once the base style has finished loading. map.addSource("parcels", { type: "vector", tiles: [ "https://vectortileservices3.arcgis.com/GVgbJbqm8hXASVYi/arcgis/rest/services/Santa_Monica_Mountains_Parcels_VTL/VectorTileServer/tile/{z}/{y}/{x}.pbf" ] }); map.addLayer({ id: "parcels-fill", type: "fill", source: "parcels", "source-layer": "Santa_Monica_Mountains_Parcels", }); -
Add
paintproperties to color the parcels light blue.The
source-layerproperty tells MapLibre GL JS which layer within the vector tiles to display. If you enter thesource-layerproperty incorrectly, nothing will display.The
paintproperties control the visual attributes of the layer and are specific to the type of layer.For more information, see the MapLibre Style Specification.
Use dark colors for code blocks map.once("load", () => { // This code runs once the base style has finished loading. map.addSource("parcels", { type: "vector", tiles: [ "https://vectortileservices3.arcgis.com/GVgbJbqm8hXASVYi/arcgis/rest/services/Santa_Monica_Mountains_Parcels_VTL/VectorTileServer/tile/{z}/{y}/{x}.pbf" ] }); map.addLayer({ id: "parcels-fill", type: "fill", source: "parcels", "source-layer": "Santa_Monica_Mountains_Parcels", paint: { "fill-color": "hsl(200, 80%, 50%)", "fill-opacity": 0.5, "fill-outline-color": "white" } }); });
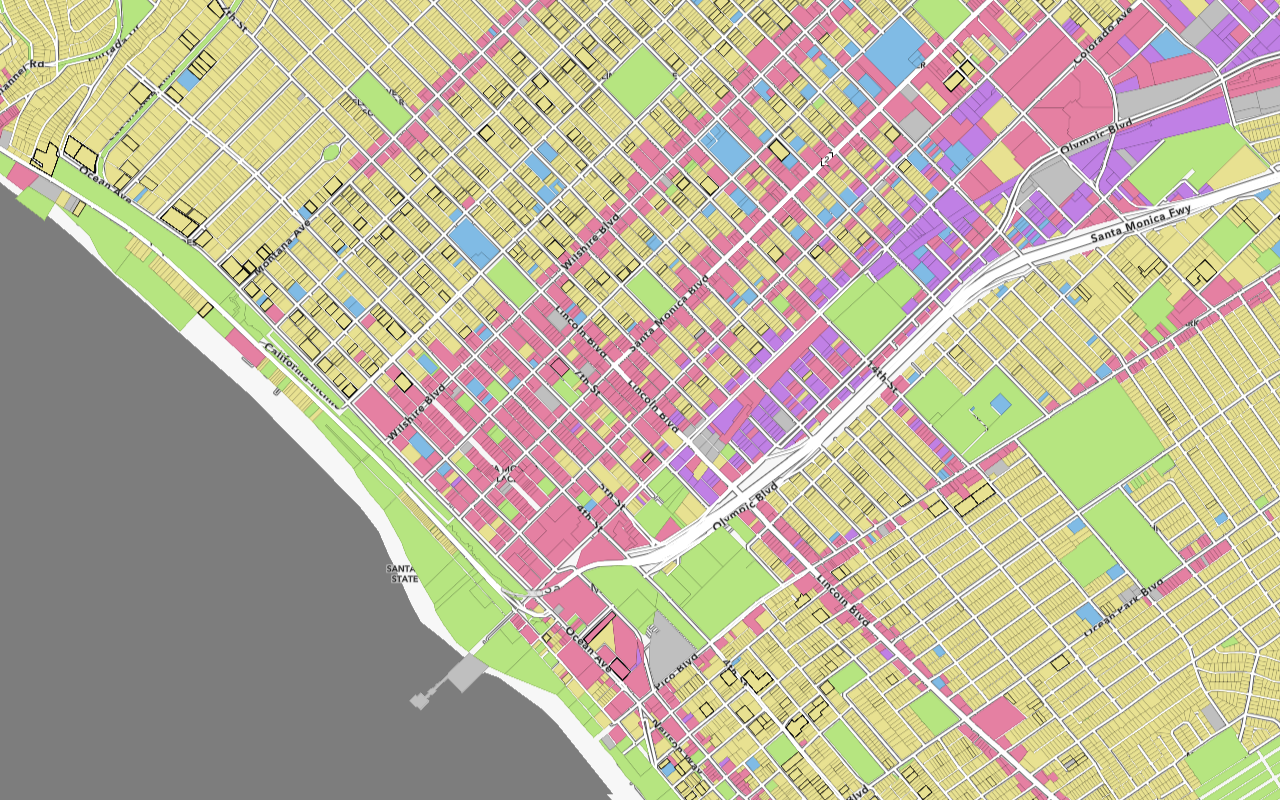
Run the app
In CodePen, run your code to display the map.
You should see the vector tile layer with parcels displayed on the basemap layer.
What's next?
Learn how to use additional ArcGIS location services in these tutorials: